22 December 2017

By Anthony O’Brien, Banking & Payments Federation Ireland and Mohammad Jamei, UK Finance
Ireland and the UK were significantly affected by the financial crisis in 2007-2008, though the two countries experienced different boom and bust cycles. The Irish market experienced stronger price growth in the lead up to the financial crisis but also had a larger house price correction in the aftermath. The UK housing market by comparison experienced less house price growth and correction relative to Ireland.
This research looks at the Irish and UK housing and mortgage markets, with a specific focus on first-time buyers (FTBs) and their characteristics. The first section looks at housing supply and demand in both countries, the second section looks at how characteristics of FTBs have evolved over time and the third section looks at government housing schemes and regulation. In our conclusion, we bring these elements together.
While the focus of this article is predominantly on FTBs, they must be considered in a wider housing market setting, as they are subject to external pressures from other parts of the housing and mortgage market. One of these factors is housing supply and demand.
Housing demand is driven by a number of factors, including population growth, migration, an ageing population, family formation and the proportion of young people embarking on further education. We also look at housing demand by tenure, as different tenures have seen been influenced by these changes in different ways. Housing supply in both countries has been a major issue in recent years and there are strong concerns that the available stock has fallen short of meeting demand.
Trends in the key household formation age groups (18-29 year olds and 30-40 year olds) have been very different in Ireland and the UK. The number of 18-29 years olds in the UK rose by 15% between 2004 and 2015, while the number of 30-40 year olds fell by 8%.
By contrast, the Irish 18-29 year old segment shrank by 20% over the same period, while the number of 30-40 years grew by 15%. The fall in the younger cohorts is attributed to high net outward migration. These figures imply that housing demand is increasing in the UK. Due to outward migration between 2011 and 2015, demand in Ireland may be artificially low. However, net immigration returned in 2016 and it is expected to grow in coming years, adding to demand.
Europe’s population is ageing and though Ireland and the UK have two of the youngest populations in Europe, the median age is expected to rise by 6.3 years and 5.2 years in Ireland and the UK, respectively, by 2080. The share of the population aged 65 years or more will grow significantly: almost doubling to 27% in Ireland and jumping to 28% in the UK.
The headship rate among older people is also higher as older people are more likely to live alone. Eurostat indicates that 29% of the population aged 65 or more lived alone in 2011 and “while a higher proportion of the elderly population lived in rural regions, those who were in urban regions were more likely to be living alone”[i]. In addition, relatively few older households move residence each year (3-4%), with most of those moving to other private housing. These findings imply higher headship rates where residential property is most scarce.
Couples are marrying much later than in the previous generation. The average age of grooms in Ireland rose from 26.2 years in 1977 to reach 35.3 years in 2015, according to the Central Statistics Office (CSO), while the Office for National Statistics (ONS) reports that the average age in the UK rose from 28.8 years in 1974 to 37 years in 2014. Women marry, on average, about two years earlier than men.
The average age of new mothers has also increased since the 1970s. The increase in the average age has accelerated in Ireland in recent years. Underlying that change is a significant drop in the number of first-time mothers since 2009 and the increasing importance of older age groups: 30-44 year olds rose from 45% of new mothers in 2008 to 59% in 2015.
Higher educational attainment – which typically leads to higher levels of income – increases the likelihood of individuals forming households, but at an older age, as they remain in education for longer. On the other hand, individuals who leave the education system earlier typically enter the labour market and form a family at a younger age. As a result, household formation in the youngest-age groups are typically driven by individuals entering the labour market, while higher education drives formation rates as individuals get older.
Housing tenures broadly fit into three categories: social housing (renting from local authorities or housing associations), private rental and homeownership. A number of factors may influence housing tenure and demand for different tenures. We consider these in the context of each tenure.
Some households rely on social or subsidised housing. The provision of social housing by local authorities has been steady in Ireland, accounting for 6-7% of housing stock in recent years, but it has fallen in the UK.
Local authority housing in the UK accounted for 11% of the housing stock in 2005, falling to just 8% by 2015. Housing associations have made up the shortfall as the stock of housing association properties exceeded local authority properties for the first time in 2008. By 2015, housing associations and local authorities combined accounted for 18% of the housing stock, up slightly from 14% in 2005.
As in the UK, housing associations have emerged as important providers of housing in Ireland with housing association
Demand for rental properties has been and is likely to remain strong. The factors underpinning this include demographic and social changes with population growth and immigration, while a growing number of people live alone; some opting to settle down later in life while others remain in education for longer.
Pressure from other tenures is another reason, as high house price growth relative to earnings means those wanting to buy need to save for longer and as a result remain in rented properties for longer too. It has also meant that, for some, buying a home may no longer feasible, so living in rented accommodation can become permanent.
Most people in Ireland and the UK live in owner-occupied housing. However, both countries have experienced similar falls in homeownership since the mid-2000s. The percentage of people living in owner-occupied housing dropped from about 78% and 70% in Ireland and the UK, respectively, in 2005 to 70% and 63% by 2015, according to Eurostat.
This is the result of a mixture of factors discussed earlier.
There are two sources of supply in the private housing market:
As the UK population is nearly 14 times larger than Ireland’s, the measure we use is population per housing unit (PPHU) so that the comparison is like-for-like.
The Irish housing market grew rapidly in the 1990s and early 2000s with the PPHU dropping from 2.99 in 1991 to about 2.29 by 2006. The UK grew more slowly dropping from 2.43 to 2.29 over the same period. Since then, the PPHU in both markets has levelled off.
The downward trend in the Irish PPHU coincided with the significant expansion of the housing stock up to 2006. Even where owners would like to sell they may not do so for a number of reasons including a preference to remain on an attractive existing mortgage rate, negative equity or a lack of suitable homes to buy.
New properties account for a relatively small share of property transactions. About one in ten property sales between 2010 and 2016 were for new properties. However, new properties add to the existing stock and increase the capacity of the housing market to absorb new households. A healthy housebuilding sector is crucial for the housing market to function properly.
Unfortunately, the housebuilding sector has been operating at or near historically low levels since 2009-10 in both countries.
While residential building planning permissions in the UK recovered to 2000 levels by 2016, in Ireland activity in the period 2011-2016 was four to five times lower than 10 years earlier. For building starts and completions[ii], similar patterns emerge[iii].
In the UK, activity declined after 2007 but by 2016 it was slowly rising and above 2009 levels to about 10 commencements or completions per thousand 18-40 year olds.
Building activity in Ireland, however, fell sharply after 2006 with both commencements and completions running at about one-fifth the level in 2004. By 2016, Ireland also had about ten commencements or completions per thousand 18-40 year olds (similar to the UK) but that compared with about 53 commencements and 52 completions per thousand in 2004.
FTBs may come from the parental home, social housing or private rented accommodation. This often determines if they are forming a new household. Those leaving the parental home are forming new independent households but those coming from social housing or private rented accommodation are not unless they lived in shared accommodation.
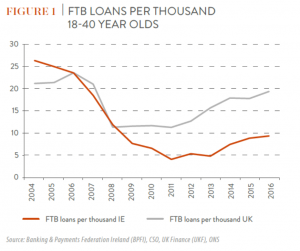
Following the boom and bottoming of the mortgage market in the 2000s, FTB activity has been growing since 2011 in the UK and 2013 in Ireland. The UK market has recovered strongly with 19.4 FTB mortgage drawdowns per thousand 18-40 years olds in 2016, the highest level since 2007. In Ireland, there were 9.3 per thousand, the most since 2008. However, while UK volumes are close to the 2006 peak of 23.6, Irish volumes are well short of the peak on 26.4 in 2004.
In volume terms, FTBs peaked in 2004 in Ireland and in 2006 in the UK. The FTB share of mortgaged house purchases in Ireland fell below 35% in 2005 but jumped to more than half from 2009, partly due to the sharp fall in buy-to-let activity. In the UK, FTBs accounted for less than 35% until 2012 but by 2016, they accounted for more than 40% of new mortgaged house purchases.
Although we should not look at FTBs in isolation. In the mid-2000s, rising house prices led to FTBs making up a small smaller portion of the market, relative to home movers. Between 2004 and 2012, movers accounted for more than half of property purchase mortgages in both Ireland and the UK. By 2016, movers’ share of new purchase mortgages had fallen for six successive years in the UK and two in Ireland.
The relative decline of movers suggests reduced market liquidity. This limits supply of second hand properties for sale, possibly because they are in negative equity, they have an attractive mortgage rate that they do not want to lose, or because of relatively high transaction costs. This has a knock-on effect on sales where those willing or able to sell may struggle to find a suitable property to buy.
Over the last 12 years, the characteristics of FTBs have evolved differently between Ireland and the UK. Capital cities typically have different traits compared to the rest of the country, so Dublin and London are also looked at separately.
We consider the following factors:
And look each characteristic in turn.
The median age of an FTB in the UK has been 30 years, give or take a year, for the past twelve years. London is similar with a slightly higher average age, at 31. While the median age has been stable, the age distribution has been changing.
In Ireland, the median age began to rise in 2012, reaching 33 years of age in both Dublin and the country as a whole by 2015. In 2004, nearly half (49%) of FTBs in the UK and 60% of FTBs in Ireland were 30 years or younger. By 2016, this proportion had grown slightly in the UK to just over half (54%) of all loans, while in Ireland it was down to just over a quarter (29%).
There is an even stronger divergence when focussing on FTBs under 26 years of age. In both countries, they accounted for around one in five (22% in the UK, 19% in Ireland) FTBs in 2004. By 2016, one in five (21%) FTBs in the UK were still in that age bracket, but in Ireland, this had fallen to just one in 33 (3%).
The same trends that are observed in Ireland are also observed in the capital city, Dublin. Around one in five (18%) FTBs in 2004 were younger than 26, but by 2016 only 2% of FTBs were in this age group. For the UK, different trends have been emerging from London compared to the rest of the UK, especially amongst younger FTBs.
Those aged under 26 accounted for 14% of all FTBs in 2004 in London. But unlike the rest of the UK, this proportion did not stay stable over time. In London, this group accounted for just 9% of all FTBs in 2016.
The most visible trend when looking at loan-to-values (LTVs) is that higher LTVs (above 90%) are much less prevalent than in the pre-crisis period. While there has been some recovery in higher LTV lending in 2016, it is still on a much smaller scale than it was back in 2008, or even 2004. By 2016, higher LTV lending in Ireland accounted for a historically low proportion of the FTB market.
In the UK, higher LTV lending accounted for 38% of loans to FTBs in 2004. This proportion fell away in 2008 and continued to fall in 2012. Given house prices were falling over much of that period, the supply of higher LTV loans fell sharply as lender’s risk appetites reduced and the gap between borrowers’ financial resources and property prices narrowed. By 2012, just 3% of lending was at these higher LTV bands. Since 2012, the picture has improved somewhat, partly as a result of government schemes, and 13% of loans were above 90% LTV.
Higher LTV lending in Ireland accounted for more than half of all FTB loans (53%) in 2004, rising to 62% in 2008, before contracting sharply in 2012 and 2016, to 31% and 6% of all loans, respectively. Loans in the band just below (81-90%) accounted for most of the lending in 2016. Although regulatory limits on LTVs were introduced in 2015, the prevalence of higher LTVs had already declined.
The capital cities broadly followed the national trends but by 2016 there was a larger proportion of loans in the lower LTV bands in the capital cities than in the rest of the country.
In both the UK and Ireland, macro-prudential regulation has been put in place over the last few years which will have affected the distribution of loan-to-income ratios (LTIs), which is explored  later on.
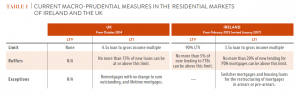
In short, the Financial Policy Committee (FPC) in the UK imposed a soft cap on LTIs at 4.5, with 15% of new loans allowed to be at or above that limit. This came into effect in October 2014. In Ireland, LTIs for home buyers have been limited to 3.5 by the Central Bank of Ireland (CBI) since February 2015 but 20% of new lending is allowed to exceed this limit.
LTIs in the UK have been increasing over time. Lending below an income multiple of 3 made up more than half (53%) of all lending in 2004 in the UK. This has steadily fallen over time and by 2016 it only accounted for a third (32%) of lending to FTBs, driven by a shift to the higher LTI bands. So while lending above 3.5 LTI was only a third (31%) of all lending in 2004, it now account for the majority (51%) in 2016.
Growth in higher LTI lending has been stronger in London. Lending above 3.5 LTI accounted for 43% of all lending to FTBs in 2004. By 2016 this had grown to 68%. While average LTVs are typically lower in London than the rest of the country, average LTIs have been higher. This is likely to reflect risk appetite for lenders as they either allow borrowing at a high LTI or LTV, but not both. This means Londoners need to provide a larger deposit, but can borrow a higher multiple of their income.
Ireland had a similar distribution in LTIs relative to the UK in 2012. However, after the CBI’s LTI rules were implemented lending in the 3 to 3.5 LTI band grew as a proportion of the total to reach a third (31%) from just 17% in 2012. This bunching is also evident in Dublin, as the proportion in the 3 to 3.5 LTI band grew from 18% to 40%. Lending above this band has fallen across Ireland and in Dublin between 2012 and 2016.
Stretching mortgage terms is one of the ways that FTBs can borrow more, allowing them to transact as prices increase. Itis no surprise then that the average length of an FTB mortgage is no longer 25 years and there has been a steady movement towards longer term mortgages.
One in three (33%) mortgages taken out by FTBs in the UK were over 30 years in length by 2016.
A similar story can be seen in London, where most loans in London fell into the 21 to 25 year category in 2008. By 2016, the picture was markedly different, as the proportion of loans over 30 years long had more than tripled to 31%, from 9%.
Ireland has experienced a similar trend to the UK of longer mortgage terms, except in 2008, which was a bit of an anomaly, as mortgage terms over 30 years accounted for two-thirds (65%) of activity, whereas in 2004 the same figure would have been 23% and in 2012 it was 39%. This was the same for Dublin too.
Loan terms lengthened significantly up to 2008 in Ireland at a time when house prices were peaking and affordability was stretched. For example, the median term had reached 33 years in Dublin before easing back and levelling off at 30 years.
Apart from this blip; there has been a trend of the higher loan term buckets accounting for a larger portion of FTB loans.
A relatively small number of FTB mortgages have been advanced on an interest-only basis in Ireland. One in 25 (4%) mortgages advanced to FTBs in 2004 were interest only, rising to one in 20 (5%) in 2008 then rising slightly again (6%) in 2012 before effectively disappearing from the market. We only have data for 2012 and 2016 for Dublin, and in both of those periods almost all loans to FTBs were on a capital and interest basis.
This is a very different picture to the UK, where in 2008, about one in four (26%) mortgages were interest only. This was even higher in London, as nearly half of all FTB loans (45%) were interest only. By 2012 however, this proportion had fallen to one in 50 (2%) in the UK and one in 20 (5%) in London. As with Ireland, interest-only loans were virtually non-existent by 2016.
After the financial crisis, interest-only mortgages became less popular in the UK for lenders and borrowers. In 2014, new regulation[i] was implemented which meant interest-only loans could only be made in certain situations and where there was a credible repayment strategy.
The effective disappearance of interest-only mortgages in Ireland seems to reflect a change in lender appetite rather than regulatory intervention. Between 2009 and 2011, interest-only mortgages accounted for only about 2% of new FTB loans. That preceded the Consumer Protection Code 2012 which specified that lenders “must carry out an assessment to ascertain the personal consumer’s likely ability to repay the principal at the end of the mortgage termâ€.
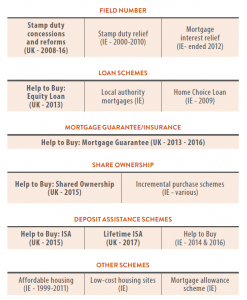
There have been a number of government schemes over the recent past in Ireland and the UK. The focus of many of these schemes has been FTBs, either directly, as only FTBs were eligible, or indirectly, as take up had been predominantly by FTBs.
In the UK alone, there are at least eight government housing schemes aimed predominantly at FTBs. This highlights the amount of help they require to be able to transact in the UK housing market and the extent of government intervention. By contrast, the only broad Irish government schemes for FTBs is the Help to Buy scheme in late 2016, which absorbed a deposit interest tax rebate introduced in 2014. Most other FTB schemes in Ireland have aimed to move households out of social housing into the private housing sector.
Government housing schemes in the UK and Ireland aim to improve accessibility to and affordability of housing and in particular, home ownership. The broad spectrum of schemes highlights the multi-faceted nature of issues in the housing market, as house prices have grown faster than incomes, transaction costs have increased, and there has been growing demand for housing, coupled with a weak supply response post-financial crisis.
In the UK, the schemes have had varied results. The equity loan scheme, along with the mortgage guarantee scheme and the Help to Buy ISA have all seen take up stronger take up in the midlands and the north of England.
The strength of the equity loan scheme outside London and the south east has partly been down to the fact the scheme had made some sites which were previously not profitable to build on, more worthwhile for housebuilders. The reason the mortgage guarantee scheme was used more extensively in these areas was because high LTV lending is more common, while lending in London and the south east tends to be at higher income multiples, even for FTBs.
Shared ownership is possibly the only scheme where take up is stronger in London and the south east, as high house prices relative to incomes means many cannot buy a property outright, so they opt for this scheme instead.
In Ireland, most government schemes have made little impact. The main exception is mortgage interest relief but this is no longer available for new borrowers. The Help to Buy scheme has been very active in its early months but it remains to be seen whether the activity levels will be sustained or how many applicants will make it to claim stage given the lack of new housing supply.
The government schemes discussed above also cater to a range of different households, from low paid to affluent in both the UK and Ireland. Broadly speaking, the equity loan and the mortgage guarantees scheme, as well as the Irish Help to Buy scheme, benefit those at or above average incomes the most, while the share ownership schemes would help those lower down the income distribution.
The table below sets out the LTV and LTI limits in Ireland and the UK. On the face of it, the Irish measures appear more stringent with an LTV limit where none exists in the UK and a lower LTI limit, although the buffer for exemptions to the LTI limit is larger in Ireland than in the UK.
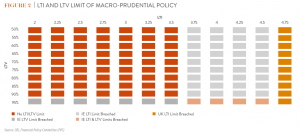
As the figure below illustrates, mortgages with LTVs up to 90% and LTIs up to 3.5 do not breach any macroprudential limits in either country. In practice, most loans to FTBs are likely to be in this category.
Loans with LTIs greater than 3.5 but less than or equal to 4.5 would breach LTI limits in Ireland but not the UK, while loans with LTI over 4.5 would breach limits in the UK. Banks in Ireland are significantly more likely to allocate exemptions to LTI limits to FTBs than movers. In the UK, the share of FTB mortgages with LTIs of 3.5 or more increased significantly between 2012 and 2016, with a bunching of activity up to an LTI of 4.5.
The exemptions for Irish FTB mortgages over 90% LTV are limited with most exemptions given to movers. As with LTIs, a significant share of LTVs are bunched between 81% and 90%.
Recent trends in FTB mortgage lending reflect general demographic factors affecting the scale and nature of housing demand, the failure of housing supply to keep up with demand, changing lender risk appetites and practices, tighter mortgage regulation to reduce demand and limit lenders’ exposure to losses and government housing schemes to support supply.
The populations in both countries continue to grow but older people account for an increasing share and this segment is expected to expand in the decades ahead. The major life events that have prompted household formation, especially marriage and childbirth, are occurring later in life. Homeownership rates have fallen in recent years as a growing proportion of households remain in private rented accommodation for longer.
However, the population profiles in the two countries have diverged for younger age groups. The number of young people (18-29 year olds) has grown in the UK over the past decade but it has fallen in Ireland. These trends largely reflect strong net inward migration into the UK and significant net emigration from Ireland. This has not only artificially reduced the number of potential new households in Ireland, it has also resulted in an older FTB cohort than before.
Both governments have introduced schemes to support housing supply though Irish schemes have been more targeted towards FTBs.
On the other hand, regulators in both countries have sought to limit lenders’ exposure to losses by limiting how much customers can borrow relative to their incomes or house values. Regulators have, to some extent, followed the lead of lenders who had already changed their risk appetites and lending practices after 2009.
High LTV borrowing (95% LTV and above) have been largely absent in both markets, especially for FTBs, for some time. However, there is evidence of loans bunching just under the macro-prudential limits in both countries: 90% LTV and 3.5 LTI in Ireland; 4.5 LTI in the UK.
Despite these challenges, FTB activity has been growing since 2011 in the UK and 2013 in Ireland.
The supply issues evident in both the UK and Ireland mean that prospective FTBs are competing with other FTBs and potentially also competing with bids from movers with housing equity or from landlords.
Unfortunately, the relative decline of movers may suggest reduced market liquidity. This limits the supply of second hand properties for sale, possibly because movers are in negative equity, they have an attractive mortgage rate that they do not want to lose or because of relatively high transaction costs. This has a knock-on effect on sales where those willing or able to sell may struggle to find a suitable property to buy.
Creating a favourable environment for FTBs must mean also addressing the needs of other residential property buyers and households in general.


The European Covered Bond Council (ECBC) is the platform that brings together covered bond market participants including covered bond issuers, analysts, investment bankers, rating agencies and a wide range of interested stakeholders.


