Covered Bonds as Financing Instrument for Green and Social Investments
MARKET OVERVIEW
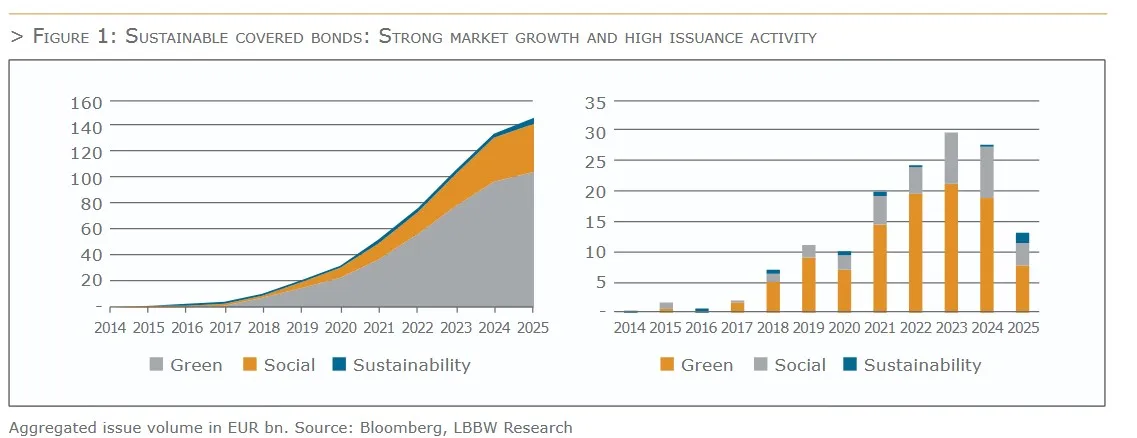
Sustainable covered bonds have been growing steadily for more than a decade now. Starting with the first issue of a sustainable covered bond in 2014, a significant market has developed for this asset class. After the first EUR benchmark sustainable covered bond transaction was launched in 2015, the market share has since gradually expanded. In the current year, sustainable covered bonds in the EUR benchmark segment have a market share of 12% of primary market activity. The market for sustainable covered bonds has also outgrown its infancy in terms of the number of issuers. To date, 86 issuers from 21 different jurisdictions have issued sustainable covered bonds. In 2024 alone, there were 59 issues of public and privately placed sustainable covered bonds of various sizes and currencies, which gives an impression of the rapid growth of the market for sustainable covered bonds. As at the end of June 2025, the outstanding volume of publicly placed sustainable covered bonds amounted to just under EUR 122 billion. These have so far been issued in 9 currencies, with EUR-denominated issues standing out. The EUR accounts for over 75% of all issues and 86% of the outstanding volume. The privately placed sustainable covered bonds account for an additional volume of over EUR 18 billion and include issues in three other currencies.
The limiting factor for further growth in the market continues to be the limited ESG assets. In addition, issuers base their considerations on the current funding levels (senior vs. covered funding) as well as the funding advantages to be achieved (“greenium”) and placement security.
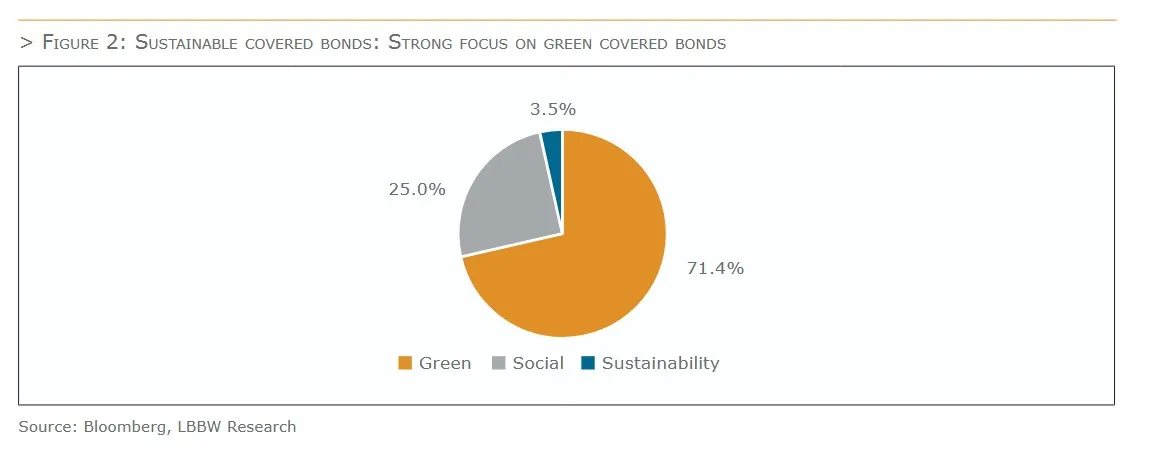
In general, sustainable covered bonds are issued in various formats, ranging from green to social to sustainability covered bonds. The issue proceeds therefore play an important role both in the area of green transformation, particularly in the building sector, and in the area of social housing, which are the two main uses of sustainable covered bonds. In addition, there are many other variations in the use of proceeds. A look at the use of proceeds of sustainable covered bonds reveals a clear trend towards green covered bonds, which account for around 71.4% of the volume of all Sustainable covered bonds issued to date. Social covered bonds account for 25.0% and sustainability covered bonds for 3.5% of the issued volume.
Looking at the type of cover for sustainable covered bonds, it is noticeable that most covered bonds are secured by mortgages, with a share of 92%. Public sector covered bonds are in second place with 7%. With a share of 1%, mixed types of cover do not play a significant role. If a distinction is made between the different types of sustainable covered bonds, the greatest variety of cover types is found in social covered bonds.
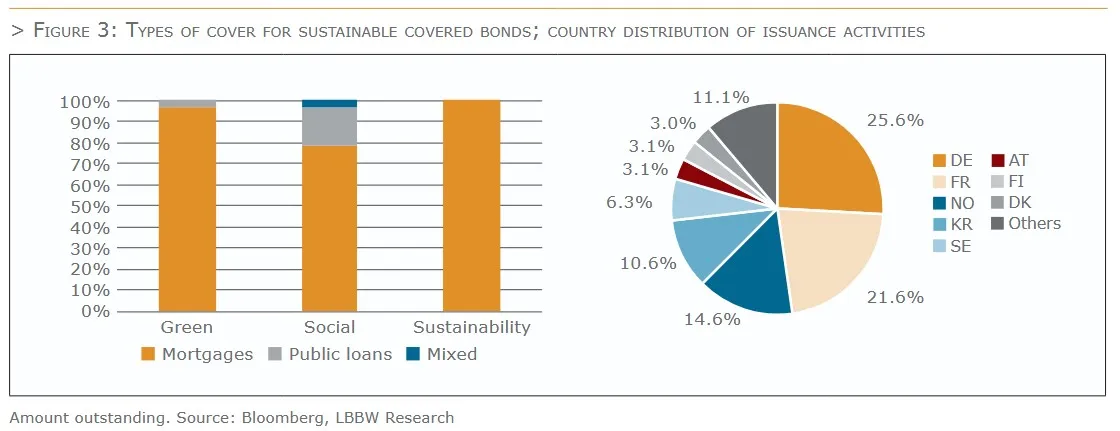
In terms of issuing countries, Germany dominates with a 26% share of the volume issued, followed by France (22%), Norway (15%) and South Korea (11%). In the most important benchmark index for covered bonds, the iBoxx Euro Covered, the proportion of sustainable covered bonds is over 10%, which underlines the fact that Sustainable covered bonds are a key component of the market. At the end of 2023, the share was only 8.4%. The volume of sustainable covered bonds in the index has now grown to a total volume of EUR 94 billion.
SUSTAINABLE COVERED BONDS FINANCE A BROAD VARIETY OF ASSETS
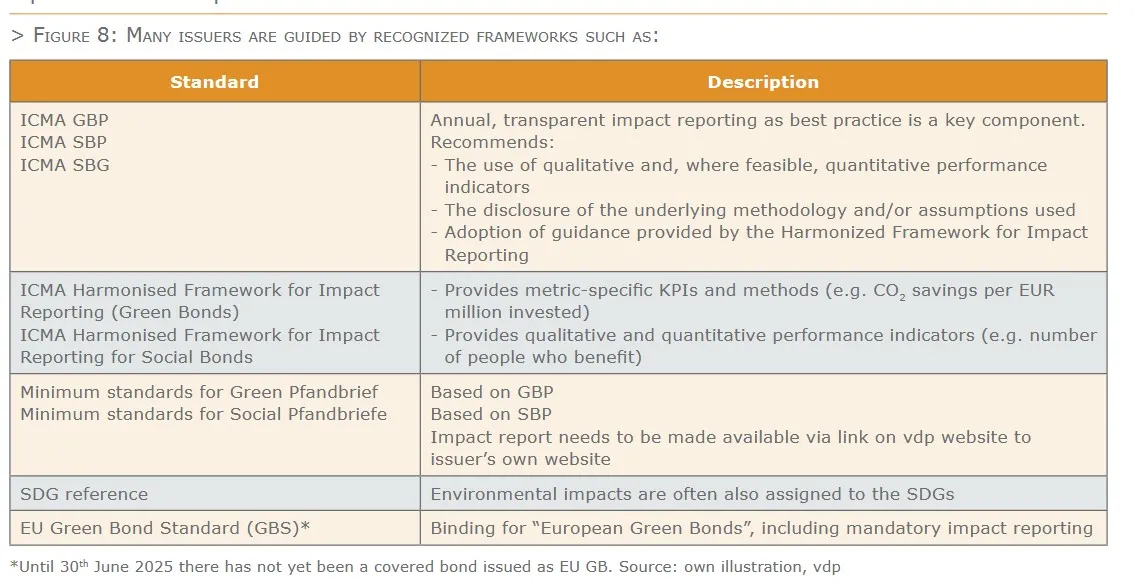
Sustainable covered bonds are mostly issued in accordance with the four pillars of ICMA’s voluntary Green Bond Principles (GBP), Social Bond Principles (SBP) or Sustainability Bond Guidelines (SBG), and have a dedicated environmentally sustainable and/or a social use of proceeds. Sustainability-linked bonds (SLB) remain scarce in the banking segment and have not yet been issued in covered bond format. These ICMA frameworks promote best practices through global guidelines, emphasizing the importance of impact and disclosure in the sustainable bond market.
> GBP were first introduced in 2014, marking the beginning of a structured approach to green finance in the bond market;
> SBP followed in 2017, replacing earlier guidance and addressing the growing need for financing projects with social impact;
> SBG were introduced in 2018 to support bonds that combine both green and social objectives.
The Principles put emphasis on transparency and integrity of the information that is disclosed and reported by issuers through four core components and two key recommendations.
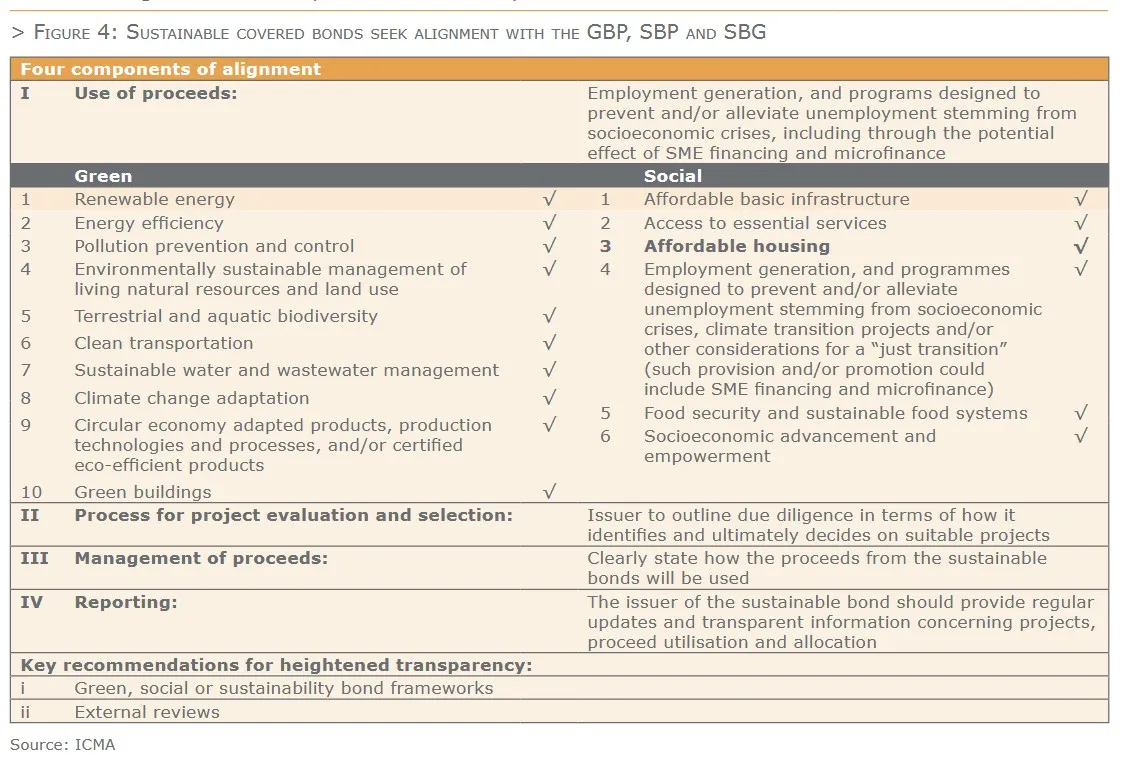
The ICMA promotes two recommendations for transparency.
(i) Issuers should explain the alignment of their sustainability bond with the four core criteria in an ESG bond framework. In doing so, issuers are encouraged to also incorporate any relevant information on their overall ESG strategy.
(ii) Issuers are recommended to seek pre- and post-issuance assessment by an external review provider to ensure that projects financed and the reporting are aligned with the use of proceeds and commitments set out in the bond framework. Also, issuers should consult the Guidelines for External Reviews for recommendations and explanations on the different types of reviews.
The exclusivity of assets that secure green/social bonds versus non-exclusivity
A key feature of use of proceeds bonds is that they (re)finance an earmarked portfolio of new or existing eligible green and/or social assets. This portfolio may have an overlap with assets that are eligible as cover pool assets but does not necessarily have to.
The ICMA Principles make a clear distinction between secured green/social bonds where the net proceeds are used to (re)finance sustainable assets that exclusively secure the green/social bonds only (secured green/ social collateral bonds) versus those where the (re)financed sustainable assets may or may not secure the specific bond in whole or in part (secured green/social standard bonds).
At this point only the social covered bonds issued by one of the South Korean covered bond issuers meet the definition of secured green/social collateral bond. All other sustainable covered bonds outstanding would fit into the category secured green/social standard bond.
Within the latter category of bonds, there are sustainable covered bonds that allocate proceeds to a portfolio of sustainable loans that are not part of the cover pool. Separate from their use of proceeds, these sustainable covered bonds are secured by sufficient cover assets meeting the asset eligibility criteria stipulated by law and/ or the bond programme documentation.
However, most sustainable “standard” covered bond issuers would generally strive to have sufficient eligible green and/or social loans in the cover pool to at least match the amount of sustainable covered bonds out- standing. For that reason, these loans not only have to meet the criteria stipulated in the sustainable bond framework, but also the asset eligibility criteria under the respective covered bond legislation or programme documentation. It is important to bear in mind that sustainable and vanilla covered bonds issued against one cover pool do have the same preferential claim on both the sustainable and non-sustainable assets that are part of the cover pool.
Some banks issue both green and social covered bonds against the same cover pool, either under one single sustainability bond framework, or via separate green and social frameworks. In turn, there is also an example of a covered bond issuer that issues both social public sector covered bonds and social mortgage covered bonds via the same social bond framework. Moreover, proceeds can be assigned to a distinct portfolio of assets per bond, or to a broader portfolio of sustainable assets (re)financed by multiple sustainable (covered) bonds (portfolio approach). The latter approach is most common.
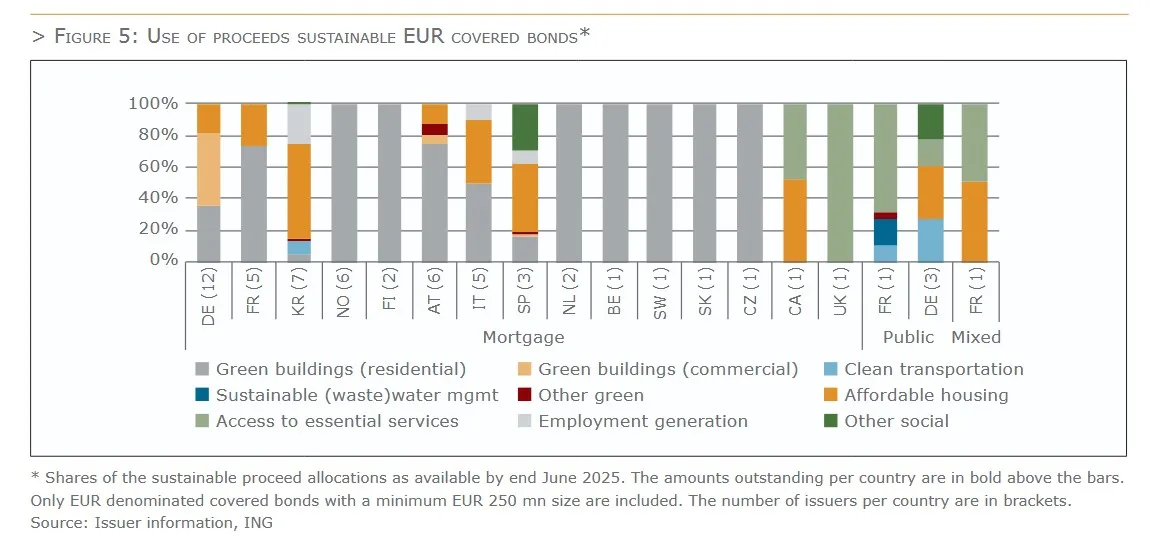
Green mortgage covered bonds primarily finance energy-efficient commercial or residential buildings (64% of all use of proceeds), with green residential real estate loans being the most important use of proceeds category (51%). Banks with mortgage cover pools (partly) comprised of social housing loans often issue social or sustainability mortgage covered bonds. Affordable housing loans represent 21% of the sustainable covered bond use of proceeds aggregate.
Access to essential services is the most important use of proceeds category for sustainable public sector covered bonds (6% of all use of proceeds). Public sector covered bonds were at first solely issued in social format to finance community projects in areas of healthcare and education. However, there are nowadays also public sector covered bonds outstanding with a green use of proceeds, (re)financing among others clean transportation projects (2% of all use of proceeds).
Matching the use of proceeds with the sustainable development goals
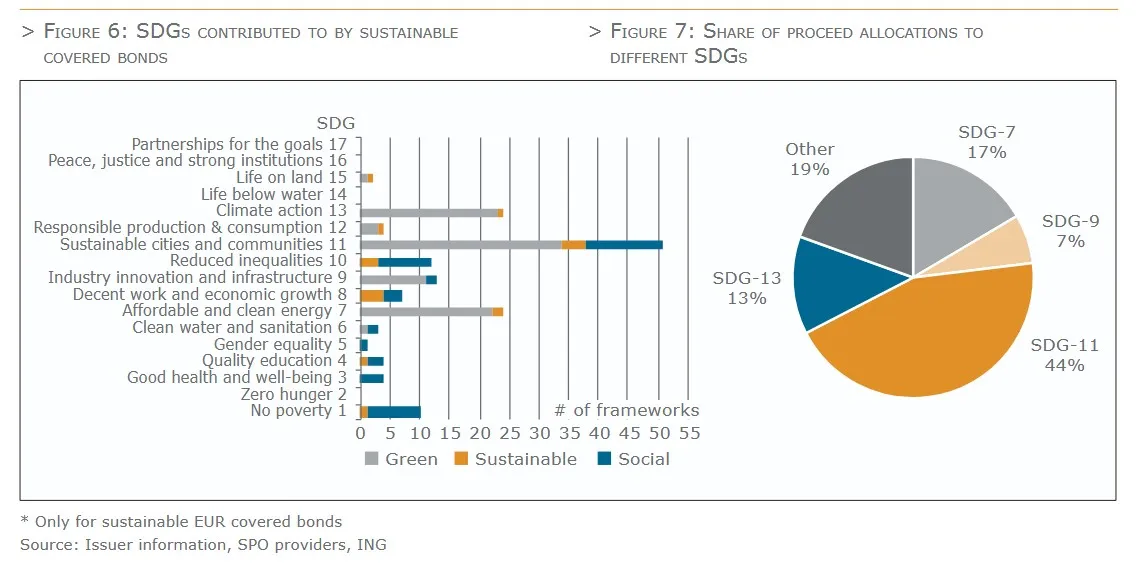
Sustainable covered bonds generally also aim to support the achievement of the United Nations sustainable development goals (SDG), established in 2015. Green use-of-proceeds bonds tend to align with a narrower set of SDGs compared to those focusing on social objectives. Among them, sustainable cities and communities (SDG 11) is the most frequently targeted goal.
While most sustainable bond frameworks indicate which SDGs are supported per use of proceeds category, only few banks report the exact allocation of proceeds to specific SDGs. To estimate how sustainable covered bond proceeds are distributed across the SDGs, we applied a pro-rata matching of the reported proceed allocations to the SDGs associated with each use of proceeds category. This analysis suggests that 44% of all sustainable covered bond proceeds support SDG 11 – sustainable cities and communities. This is followed, at a considerable distance, by SDG 7 – affordable and clean energy (17%), SDG 13 – climate action (13%) and SDG 9 – industry, innovation and infrastructure (7%).
Impact reporting – Time to take stock
Besides issuer disclosures on use of proceed allocations, impact reporting for green and social covered bonds is a key instrument for ensuring the transparent and credible use of the funds raised. It allows investors, regulators and the public to understand how and to what extent environmental and/or social goals have been achieved. For issuers, it is about demonstrating transparency and credibility to investors.
If the covered bond issuer is a credit institution that issues other forms of green or social bonds, such as senior unsecured, rather than a specialised institution that issues only covered bonds, the impact report will often show data related to the whole green or social portfolio. In rare cases, the issuer discloses a separate impact report for the cover pool.
Impact reporting involves presenting the environmental and social impact achieved by projects financed by green, social or sustainability bonds in quantitative and qualitative terms. As the objectives of financing green or social projects differ, the indicators used to measure the impact of the proceeds from issuance depend primarily on the intended use. While carbon performance is one of the key performance indicators for green covered bonds (whether they finance or refinance green buildings or green transport), the indicators for social covered bonds are more varied due to the vast range of potential projects that can be financed.
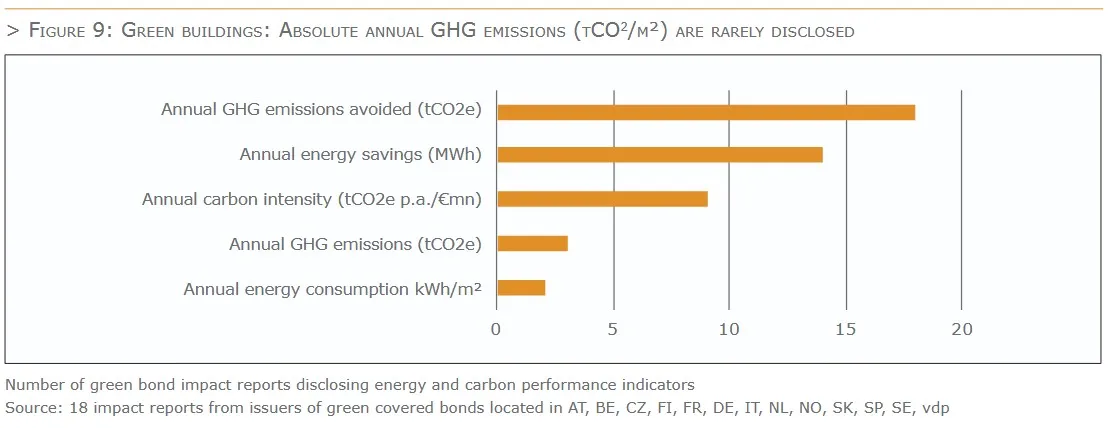
The ICMA Harmonised Framework for Impact Reporting (for green bonds) provides various core indicators to measure the energy and carbon performance, water efficiency and savings, waste management and certification standards of green buildings, where available. For green buildings, for example, the ICMA core indicators for energy and carbon performance are
> kWh/m² of Gross Building Area (GBA) p.a.; and % of energy use reduced/avoided vs local baseline/ building code
> kgCO2/m² of GBA p.a; and annual Green House Gas (GHG) emissions reduced/avoided in tonnes of CO2 equiv. vs local baseline/baseline certification level; and/or
> % of carbon emissions reduced/avoided vs local baseline/baseline certification level.
The issuers of green covered bonds, which are used to finance or refinance green buildings, typically only report on the core indicators of energy and carbon performance. When the performance indicators of a selected group of eighteen impact reports from the largest green covered bond issuers in twelve countries were examined, it was found that each issuer reported ‘GHG emissions avoided (tCO2e)’ and that fourteen reported on ‘Annual energy saving (MWh/m² or kWh/m²).’ Fewer than half of the reports indicated carbon intensity (tCO2e per million euros), and only a few disclosed the absolute amount of GHG emissions in tonnes of CO2e or energy consumption in kWh per square metre. Some of the reports even break down these figures even per building
type or provide further figures.
Although the methodologies used to calculate impact metrics, which avoid energy consumption and GHG emissions, differ slightly from one another, covered bond issuers generally calculate impacts in a two-step process. For that metrics such as energy consumption, a benchmark or reference value, energy sources, emission
factors are necessary.
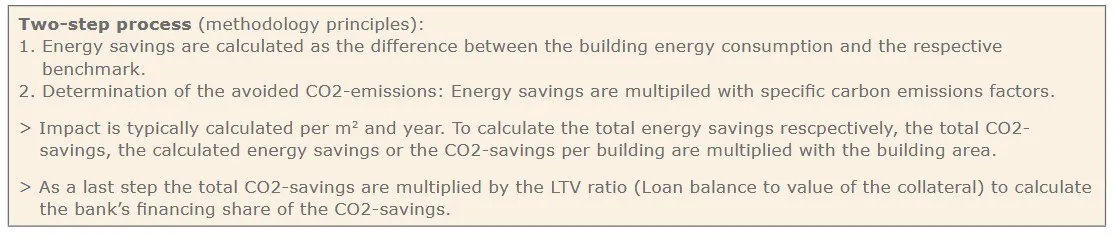
To calculate these metrics, information on the energy consumption of the underlying property, benchmark or reference value, and the energy sources and emission factors is necessary.
The primary data source for the energy consumption of the collateral is the building’s EPC. For buildings where banks are unable to obtain actual energy consumption figures, they typically estimate energy savings based on building certificate requirements, national building requirements, year of construction and/or floor area. To achieve this, a combination of different sources is often required.
The benchmark for specific energy consumption (kWh/m²) is usually determined based on the average energy demand of comparable building types, as provided by national data sources. CO2 emissions are calculated using standard conversion factors for specific energy sources (i.e. electricity mix and district heating supply) for a given region or country. Impact reports generally disclose the source of the emission factors and sometimes list the factors for various energy sources in a table, along with the applied factor(s). Sources range from national statistics created by federal agencies, industry initiatives or associations.
When it comes to the approaches used to assess and disclose GHG emissions, issuers either use national standards or those developed by the Partnership for Carbon Accounting Financials (PCAF), or they engage consultants who develop their own approaches.
Impact reporting on social projects financed by a covered bond issuer refers to the ICMA Harmonised Framework for Impact Reporting on Social Bonds. This framework provides various indicators to measure the impact of social projects.
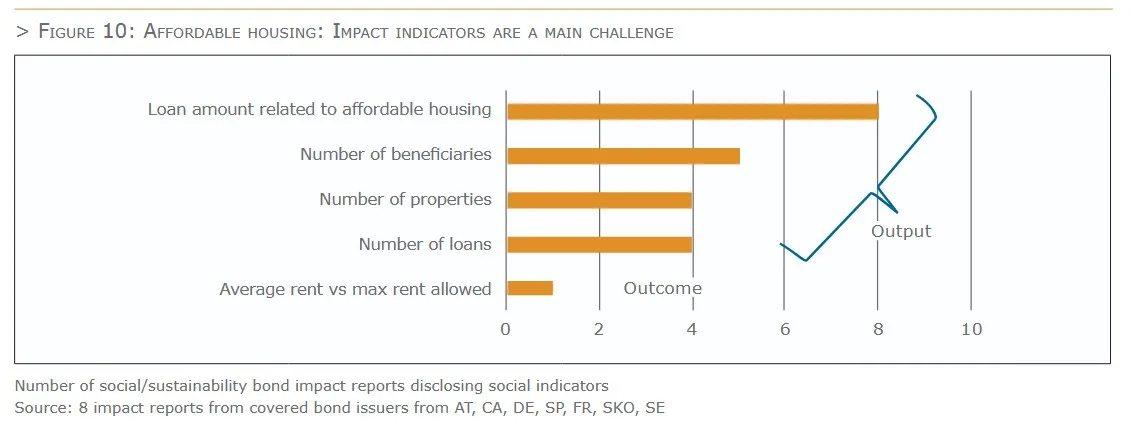
Output indicators typically focus on the number of people benefiting from relevant projects or the products resulting from an organisation’s activities. For the category affordable housing, examples of output indicators include the number of individuals or families benefiting from subsidised housing, the number of affordable dwellings built, and the number of homeless people supported. Outcome indicators measure improvements or changes in this area, including rental costs compared to regional or national rent indices and reductions in the number of people experiencing poor housing and homelessness. Impact indicators address longer-term outcomes, such as those proposed by the framework for affordable housing: improved safety and shelter.
Examining a selected group of eight impact reports from the largest social covered bond issuers in seven countries, refinancing projects of affordable housing, it was found that all reports specified the loan amount related to affordable housing. Typical output indicators, such as the number of beneficiaries and the number of properties or units financed, were also disclosed. However, only one report included an outcome indicator.
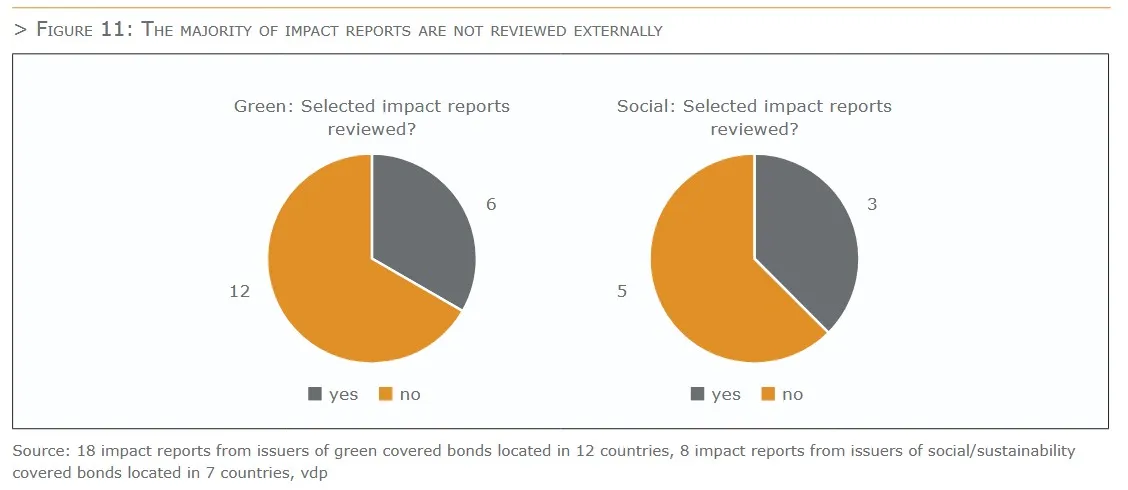
When it comes to external reviews, few issuers ask auditors or external reviewers to inspect documents and provide an assessment. Verifications differ in terms of scope, verifying either ‘and’ or ‘or’ (sometimes with limited assurance) that
> impact indicators have been prepared in compliance with the green bond framework,
> they align with best market practices using the recommended metrics by ICMA Harmonised Framework for Impact Reporting
> that issuers adopt an appropriate methodology to report the impact generated by providing comprehensive disclosure on data sourcing, calculation methodologies and granularity, reflecting best market practices and/or
> the methods for measuring impact indicators have been properly applied
> nothing has come to our attention that causes us to believe that the impact indicators are not measured,
in all material respects, in accordance with the methodology disclosed
Market Dynamics / Pricing / Relative Value
Market dynamics
Green and social covered bonds benefit from the same high security standards as regular covered bonds. At the same time, printing in green or social format involves additional costs for an issuer (i.e. additional ESG reporting, drafting and maintaining a framework, costs of SPO(s)). Hence one could assume that issuers are only willing to make these investments if printing a green or social bond compensates for these costs.
Primary market data:
From figure 12 it can be derived that both green and social covered bonds – measured by the (median) coverage ratios of their order books – are able to attract larger order books than regular covered bonds and therefore have the benefit of reduced execution risk compared to conventional format. It is important to note, however, that the social covered bond market remains relatively small, and our findings for this subtype are based on a limited set of jurisdictions.
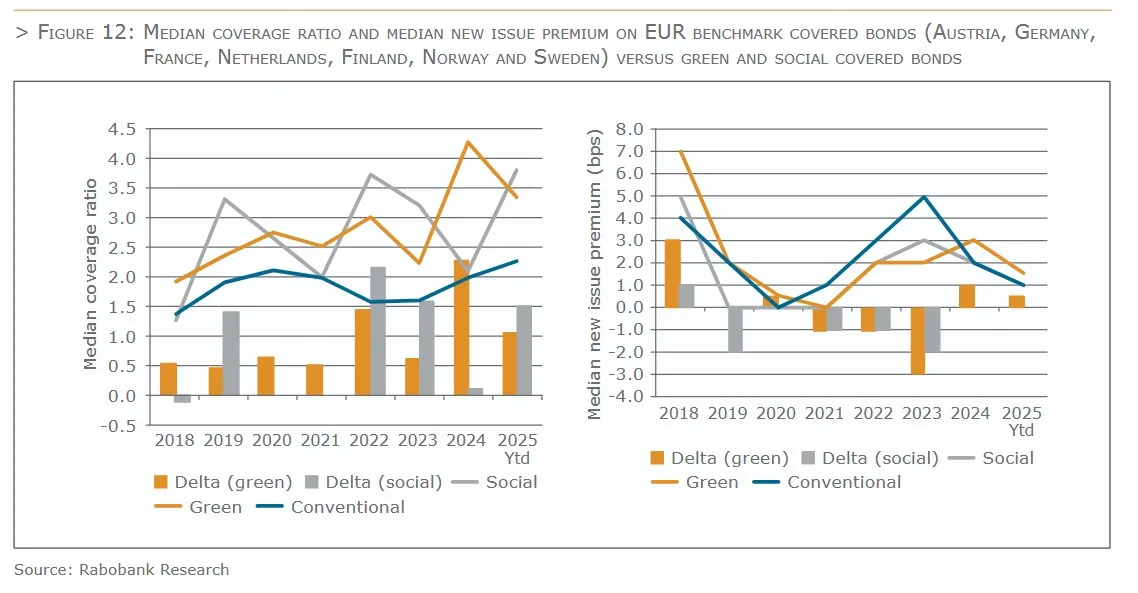
At the same time, market data on new issue premiums (NIP) as displayed in figure 12 indicates that green covered bonds were able to benefit from lower NIPs compared to regular covered bonds between 2021 and 2023. However, since 2024 we observe a different story: the median NIP for green issuances is higher than for conventional bonds. This effect is mainly driven by timing differences and issuer specific reasons. During 2024, NIPs were higher at the start of the year, a period with relatively more green covered bonds. Market conditions improved throughout the year and as a result less green issuance was printed when conditions improved and hence NIPs were lower. For the year 2025 YTD, only a few green covered bonds have been issued, making firm
conclusions difficult. As a result, a single observation can already give a distorted picture. The overall conclusion for 2025 is that there is no visible greenium.
Our analysis of social covered bonds reveals a similar trend with the NIP differential between social and conventional covered bonds having disappeared over the past 18 months.
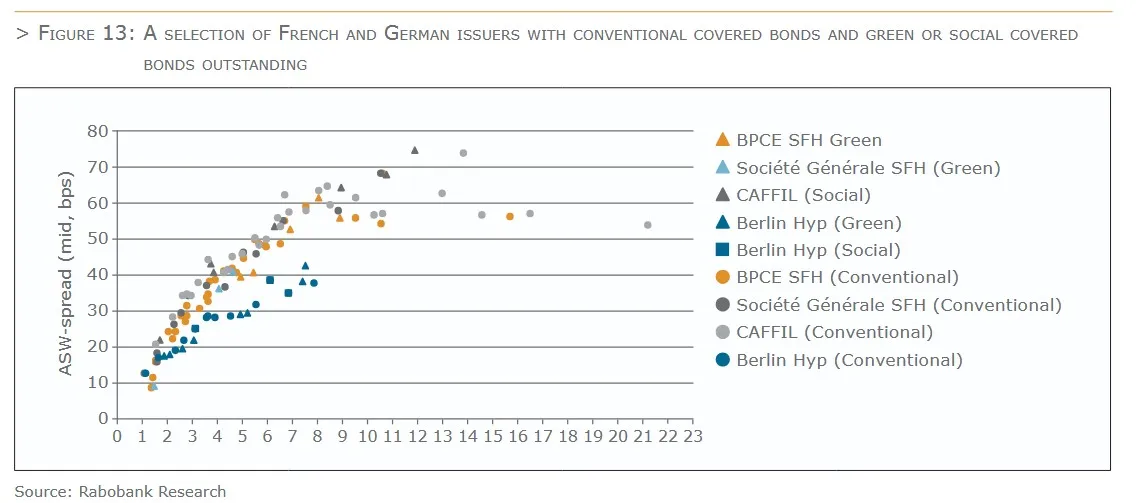
Secondary market data:
A different perspective can be generated by studying secondary market data. In doing so, we compare ASW-based average spreads on 21 June 2025 for issuers with both green and conventional covered bonds. In order to isolate (jurisdictional) spread differentials, we created two selections: (i) a German issuer and (ii) two French issuers. These market snapshots offer limited insights. Berlin Hyp shows a very modest greenium in the range of 1bp around their 3-year point on the curve, specific to one bond, with no clear greenium elsewhere on its curve. Similarly, among the French issuers, only two BPCE bonds show a greenium near the 5-year mark, with no consistent pattern across the rest of their curves. A similar issuer-level analysis, conducted for two institutions with both conventional and social covered bonds outstanding, indicates that there is no direct evidence of a social premium in the pricing of social covered bonds. This suggests that, at least for these issuers, the market does not consistently differentiate in terms of pricing.
Investor Demand
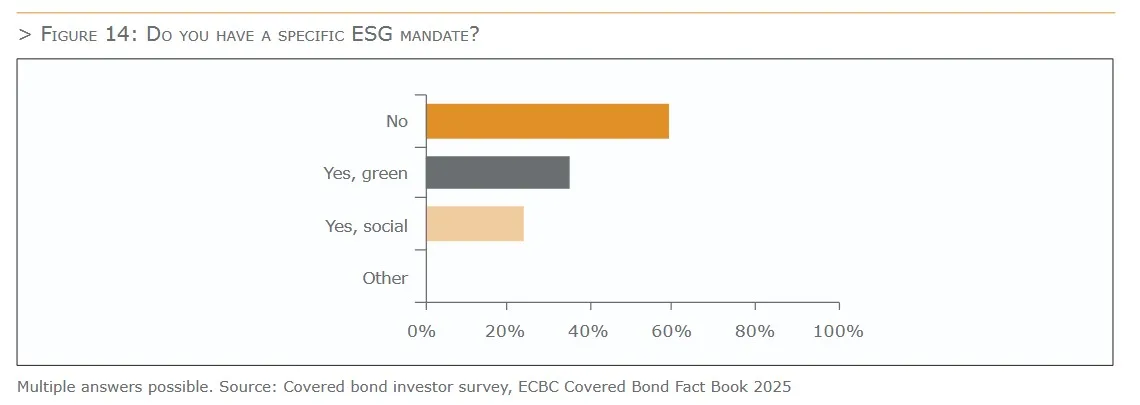
As illustrated above, sustainable covered bonds have generally been significantly oversubscribed in the primary market. Bankers report that a more diverse investor base is looking at these instruments, with both sustainability focused funds (e.g. SFDR Article 8 and 9 funds) and traditional covered bond investors placing orders. This incremental demand has not yet consistently translated into a greenium, but several market participants believe that this wider investor base could support sustainable issuance, for example during a market correction or the current high interest rate environment. As part of the ECBC covered bond investor survey, we asked investors how they were positioned on ESG topics. (The results of the complete investor survey can be found in Chapter 1.7 of this Fact Book). Although 35% of the respondents indicated that they have a green mandate and 24% have a social mandate, 59% have no specific ESG mandate.
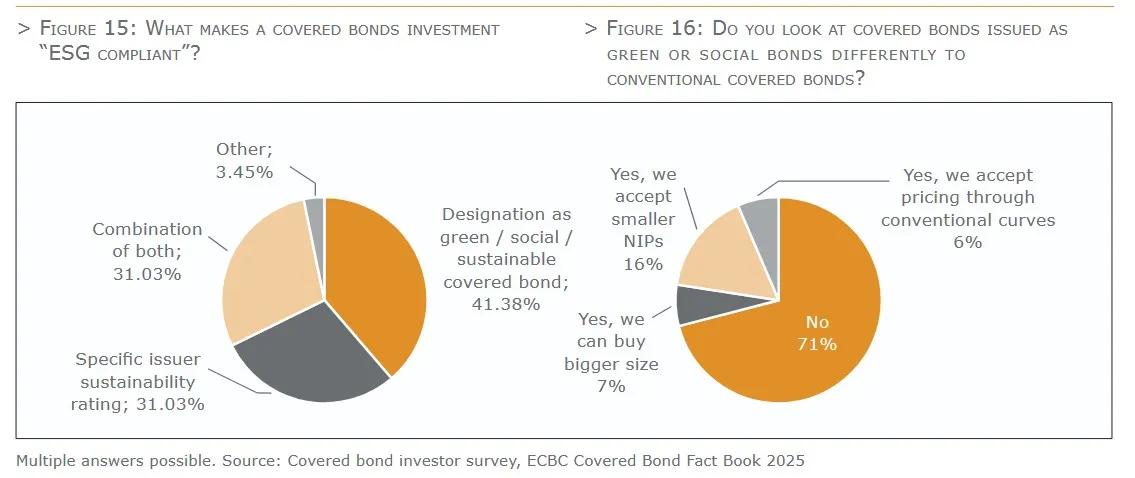
But even traditional covered bond investors generally view sustainable issuance favourably. Most have introduced qualitative or quantitative sustainability considerations into their investment policies, and green or social covered bonds tend to meet more of their sustainability objectives. Most of the surveyed investors focus on the ESG credentials specific to the covered bonds, rather than on the issuer’s ESG credentials. Most sustainable covered bond issuers have received second party opinions on the alignment of their sustainability frameworks with the ICMA principles, while it remains to be seen if the EU GBS will be widely adopted in this market.
And while 76% of the investors surveyed look at green and social covered bonds in the same way as traditional covered bonds, 15% stated they can accept smaller NIPs and 12% can either buy bigger size or accept pricing through conventional curves.
Investors identify three main sources of concern with respect to the sustainability characteristics of these covered bond programmes. The first is the lack of asset segregation, because upon issuer insolvency, eligible green or social assets will be mixed with other non-green assets in the cover pool. This resembles what would 70 happen to investors in a standard green use of proceeds bonds, as they would have the same claims against the issuer’s insolvency estate as non-green investors. The second is a lack of liquidity – sustainable covered bonds are generally easy to sell but very difficult to buy. Third is the complexity of disclosure standards relating to sustainability and/or climate-related issues and the risk of misrepresentation by issuers, perceived as greenwashing. While the structural issue of asset segregation will probably not be addressed until we see more exclusively sustainable assets covered bond programmes (i.e. secured collateral bonds), increased issuance volumes could assuage the second concern, and new rules and disclosure standards which aim to enhance transparency and consistency on sustainability-related issues may help with the third.
In terms of investor behaviour, also central banks can significantly affect the covered bond market, not only as buyers, but also by setting standards for collateral eligibility and by providing banks funding on favourable terms. In July 2022 the ECB decided to tilt its corporate bond holdings toward issuers with better climate performance and to limit the share of assets issued by entities with a high carbon footprint that can be pledged as collateral under its collateral framework. The ECB also indicated to accept, as of 2026, only collateral from companies and debtors that comply with the Corporate Sustainability Reporting Directive if they are in scope of this directive. Moreover, when the ECB finalised the review of its operational framework in March 2024, it announced that it will introduce long-term structural refinancing operations and consider a structural bond portfolio once the Eurosystem’s balance sheet begins to grow durably again, taking into account legacy bond holdings. While the ECB has not announced the details of these initiatives, it will have the tools to significantly affect the sustainable covered bond market, if it decides to do so.
Public sector covered bonds as a key instrument to finance green and social investments by the local public sector
1. INTRODUCTION
In the European Union, local governments are responsible for well over 50% of total public investments. A significant part of these investments contributes to achieving key social and environmental objectives in sectors such as education, public transportation, public healthcare, waste management and water management.
Local authorities primarily use the loan market to finance these investments. In many European countries, public sector covered bonds are used to refinance a significant share of these loans to local government entities.
2. ELIGIBILITY OF LOCAL GOVERNMENT LENDING UNDER EUROPEAN COVERED BOND REGULATION
Loans to local authorities or guaranteed by local authorities within the European Union are eligible as cover pool assets compliant with the definition provided by article 129 of the CRR. Several additional conditions apply for loans to local authorities outside the European Union:
1. To be eligible for the preferential treatment …, bonds …shall be collateralized by any of the following eligible assets:
(a) exposures to or guaranteed by central governments, ESCB central banks, public sector entities, regional governments or local authorities in the Union;
(b) … exposures to or guaranteed by …third-country regional governments or third-country local authorities that are risk weighted as exposures to institutions or central governments and central banks … and that qualify for the credit quality step 1 …, and exposures within the meaning of this point that qualify as a minimum for the credit quality step 2 …, provided that they do not exceed 20 % of the nominal amount of outstanding covered bonds of the issuing institutions
FINANCING GREEN AND SOCIAL INVESTMENTS
Local governments exercise a wide range of responsibilities across Europe. Key responsibilities include:
> Local infrastructure, including the local rail and road network;
> Primary and secondary education;
> Local and regional public transportation
> Basic services such as drinking water supply, sewerage, waste collection and treatment;
> Urban planning and development;
> Parts of the public health care system;
> Public order and safety, in particular municipal police forces, and emergency and fire-fighting services;
> Social housing
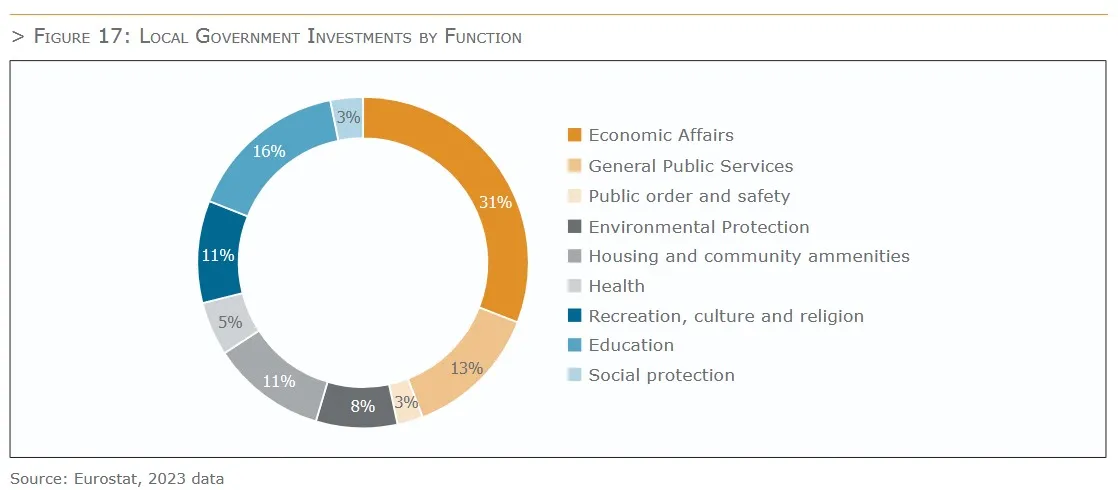
The total volume of investments by local governments in the European Union amounted to EUR 268 billion for the year 2023. A significant share of these investments has important social and environmental benefits. Public education represented more than 15% of these investments, with environmental protection (including waste management and water management) representing around 8%, and public healthcare representing around 5% of total local government investments.
3. FINANCING SOURCES FOR LOCAL GOVERNMENT INVESTMENTS
With a few exceptions, local governments generally lack the critical size for direct bond issuance on capital markets. For local authorities, direct bond issuance represents generally less than 10% of outstanding debt, with local governments across Europe relying almost exclusively on the loan market as source of funding.
4. LOCAL GOVERNMENT FINANCING PROVIDED BY COVERED BOND ISSUERS
Covered bonds represent an attractive refinancing instrument for local government lenders. Covered bonds provide issuers with the possibility to provide a large number of small loans to local government borrowers, and to refinance these assets via the issuance of liquid covered bond transactions. For investors, these instruments provide a high degree of liquidity and a strong credit quality. Germany and France are currently by far the largest markets in terms of issuance with over EUR 170 billion outstanding covered bonds for these two markets together, equivalent to more than 75% of the overall public sector covered bond market.
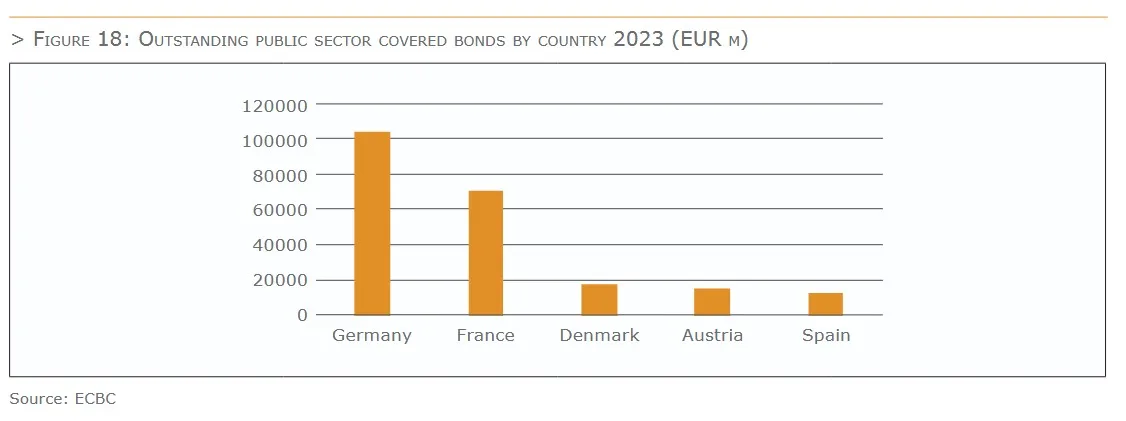
Public sector covered bonds are well established in a number of European countries. Issuance is dominated by French and German issuers representing over 75% of outstanding volumes.
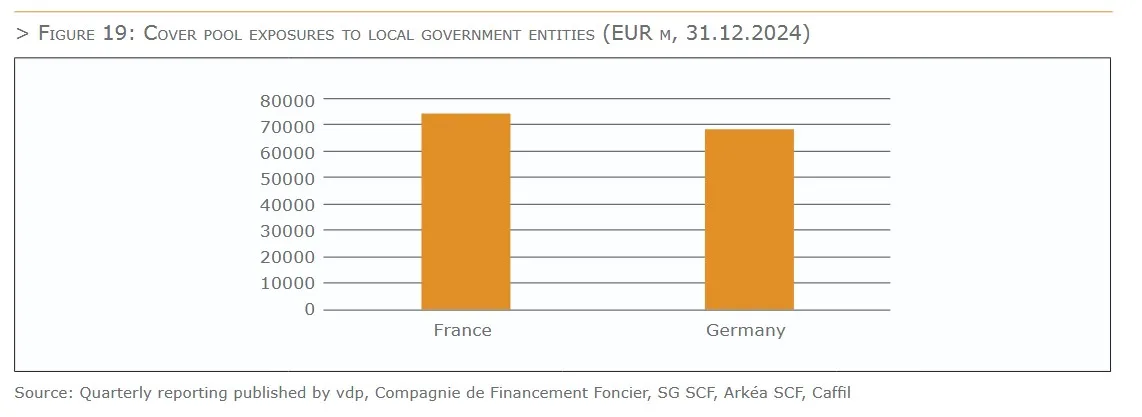
These covered bonds play a key role for the financing of local government investments. Consolidated cover pool exposures to French local government entities totaled EUR 74 billion at the end of 2024. For German local government entities, total cover pool exposures at the end of 2024 amounted to EUR 68 billion.
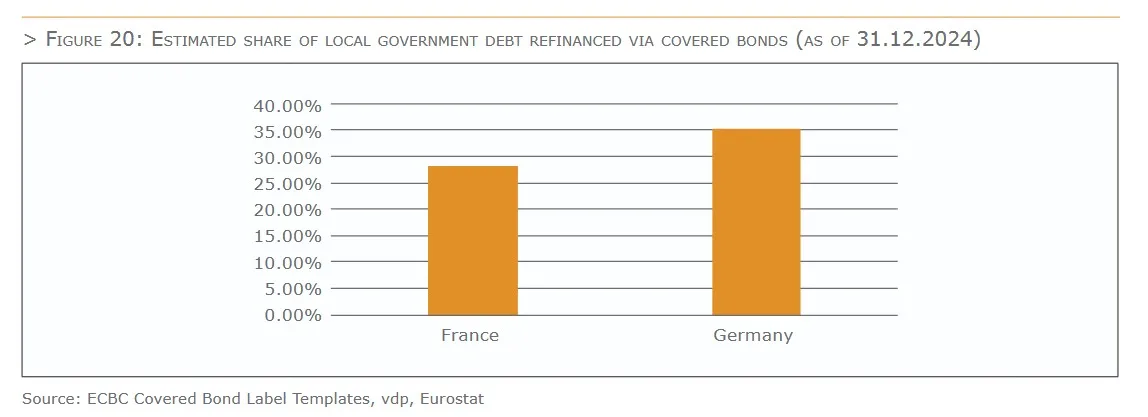
Financing provided by covered bond issuers represents a significant share of the total financing raised by local
government entities. For France, exposures by covered bond issuers represent close to 30% of total local
government debt. For Germany, loans held in public sector cover pools is equivalent to around 35% of total
German local government debt.
5. ISSUANCE OF GREEN AND SOCIAL PUBLIC SECTOR COVERED BONDS
Loans by public sector covered bond issuers will generally take the form of general purpose loans financing the overall investment budget of a local authority.
In recent years, several issuers have set up frameworks for green and social public sector covered bonds. The main challenge has been to link the lending provided by covered bond issuers to specific green and social projects.
One potential solution is to set up specific loan contracts linked to local authorities’ social or green investments. The loan contract will typically contain the necessary information to identify eligible investments, and to collect the appropriate impact reporting data.
An alternative approach is to provide financing to entities with activities limited to activities with green or social objectives, for example public hospitals, public education facilities or municipal water boards.
Investments by local authorities often have both environmental and social objectives at the same time. As an example, the construction of a new school will be an investment in public education, but at the same time it may also be considered a green project, if the construction is an energy efficient building. Another example would be the construction of a new tramway line with a focus on providing clean local public transportation, but at the same time providing important social benefits.
Green and social public sector covered bonds have been issued with financing provided to areas including healthcare, water management, waste management and clean public transportation. However, green and social bond issuance under public sector covered bond format has remained relatively limited compared to issuance of green and social mortgage covered bonds.
GREEN PUBLIC SECTOR COVERED BONDS
There are currently two issuers of green benchmark public sector covered bonds with a total of five outstanding benchmark transactions.
The proceeds of these transactions have been allocated to the following project categories:
> Clean transportation
> Sustainable water management
> Waste management
> Renewable energy
> Energy efficiency of construction
In addition, one recent green public sector covered bond transaction has also included the financing of green export contract benefiting from a public guarantee, in addition to green investments by local authorities.
SOCIAL PUBLIC SECTOR COVERED BONDS
There are currently nine outstanding social public sector covered bond benchmark transactions by two issuers.
These transactions have financed social public sector investments across the following categories:
> Essential services including healthcare, education and research
> Social housing
> Public drinking water supply
> Social cohesion including programmes for urban renewal and rural revitalization, and digital inclusion
One recent social public sector covered bond transaction has been issued to finance social export contracts with social benefits, in addition to social local public sector transactions.
By Ralf Berninger, SFIL, Antonio Farina, S&P Global, Rodger Rinke, LBBW, Sjors Hoppenbrowers, RABOBANK, Maureen Schuller, ING, Sabrina Miehs, Association of German Pfandbrief Banks (vdp)