26 September 2017


 Apart from national accounts data that have long been harmonized at the world level, international comparisons of micro-economic data on housing face many obstacles that begin with the definition of a dwelling or of a household. Since housing is not a Community competence, harmonization has waited. Efforts to collect and compare data have long been isolated and incomplete. These include the work of the ministries in charge of housing at the biennial meetings of European ministers, of the United Nations Economic Commission for Europe (UNECE), and of organizations specializing in social housing (CECODHAS) or mortgage credit (European Mortgage Federation).
The progress of European harmonization
The situation has fortunately evolved over the last decade, with the introduction of the EU Statistics System: “Statistics of Income and Living Conditions in the European Union” (EU-SILC) from 2004 onwards. This system aims to provide the European Community with a comparable database, which is updated every year and serves as a reference for the knowledge of income, living conditions and social exclusion in the Member States[2].
Of course, this is not without difficulty. As Insee stresses: “This search for pooling has its limitations insofar as it may come up against the specificities of certain countries. What can be done at the European level loses precision at the national level and does not necessarily reflect internal social phenomena in the country. With regard to concepts, there is a difficulty in establishing common definitions, a problem also encountered at the international level. The basic notions of household, housing unit, room, living area, type of construction, occupancy status, prices, refer to realities on the ground distant from one country to another”[3].
Let us look at the comparison of tenures and, more particularly, ownership rates. This is indeed one of the most popular SILC data: Hypostat, among many others, now uses SILC as the source of its table giving the ownership rates. Previously, the EMF relied on national experts to provide it with the source they deemed most reliable; the national specificities, if any, were indicated in footnotes.
The use of a single source encourages less the readers to pay attention to the risks of non-comparability. It is rightly assumed that the definitions of housing unit, main residence or ownership adopted by Eurostat differ only slightly from those of national censuses or housing surveys. The most watchful eyes will ask how of the various forms of dismemberment of ownership, rent-to-own schemes, life annuities and reverse mortgages, or farmers and share-croppers, are treated, but they only expect minor differences.
Yet the tables available on the Eurostat website and thus taken up by most publications show ownership rates that are often significantly higher than those of national sources. For example, in Germany the proportions of owners and renters changed from approximately 45-55% to 55-45%. The reason for this is simple: the data published by Eurostat are based on the statistical unit “individual” instead of “household” as it is usual and legitimate when dealing with the legal nature of the occupation of the dwelling. The ownership rates published by Eurostat are actually the proportions of people living in a dwelling whose owner is a member of the same household.
The use of this particular statistical unit introduces distortions of varying importance from one country to another (table 1). Everywhere except in Romania, the proportion of owners calculated at the household level is lower than that of the individual level. The gap is sometimes small: almost zero in Slovakia and Lithuania, and around 1 percentage point in Bulgaria, Spain, Hungary, Italy, Latvia, Portugal and Slovenia. On the other hand, it surpasses 10 points in the Netherlands and approaches this level in Denmark. It is also twice as important in Austria, Belgium, Finland, Norway and Sweden as in France. The gap is the smaller as the proportion of owners is high and the bigger as the distribution by type of household varies with the occupancy status. Single persons, for whom the two measures are identical, are 63% of tenants in Denmark but only 30% of owners, and in the Netherlands, 58% of tenants but only 21% of owners. In countries where there is no or little gap, theses proportions are on the contrary very close: in Romania, 21% of tenants and 22% of owners are living alone in their homes, in Lithuania 37% of tenants and 36% of owners, in Slovakia 28% of tenants and 26% of owners. For Germany, Ireland, as well as Iceland, Switzerland and Turkey, household level data are not available. According to various sources, the ownership rate thus defined would be in the order of 45% in Germany and 35% in Switzerland; they would therefore be the only countries where this rate is less than 50%
This change in statistical unit, from household to individual, calls into question the hierarchy of ownership rates between countries. The most notable change concerns the United Kingdom, which “loses” three places and passes behind France, which nevertheless retains its position as it is outstripped by the Netherlands, which is up by 7 points. The biggest changes concern Norway, which gains five places and Spain, which loses four.
Table 1: Ownership rates in the European Union in 2014
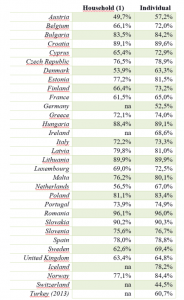
(1) Authors’ calculations Source: Eurostat (SILC survey)
Similarly, if one looks at trends rather than levels, the choice of the statistical unit is not important, at least for a few years. Table 2 shows the impact of the crisis on ownership rates: they decline in a majority of countries, with a maximum (6 points) in the United Kingdom. Among the increases, that of France (2.5 points) seems somewhat overestimated; in the Czech Republic, the increase reaches 5 points. As for Poland, the strong increase in home ownership does not seem to be sufficient to explain a 25 points progress; we suspect that there has been a change in the treatment of cooperatives.
Table 2: 2006-14 changes in ownership rates (household level)
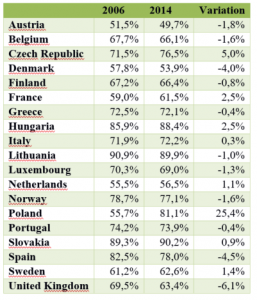
authors’ calculations; Source: Eurostat (SILC survey) ;
It is strongly discouraged to base comparisons on different sources. However, caution should be exercised also when you are lucky enough to have a harmonized source; check the manual: definitions, statistical unit, and, of course, margin of error, before enjoying statistics at the fullest.
[1] This article was initially published in French and in a longer version on the website “politiquedulogement.com”
[2] Iceland, Norway, Switzerland and Turkey also joined SILC.
[3] “Le dispositif statistique de l’ Insee dans le domaine du logement” : Etat des lieux et évaluation comparée des sources”, Collection “Document de travail” N° F1002, Insee, March 2010. Institut National de la Statistique et des Etudes Economiques (Insee) is the French Bureau of Statistics.


The European Covered Bond Council (ECBC) is the platform that brings together covered bond market participants including covered bond issuers, analysts, investment bankers, rating agencies and a wide range of interested stakeholders.


