23 November 2023

The market for sustainable covered bonds
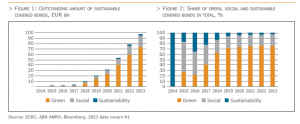
The covered bond market welcomed the first sustainable covered bond in 2014, followed by an inaugural green euro benchmark covered bond in 2015. Furthermore, the first social covered bond was also issued in 2015. The market of sustainable covered bonds has continued to expand ever since, nearing the EUR 100 bn mark by the end of June 2023. The increasing size of the market of sustainable covered bonds will be discussed in this key theme chapter, which will provide an overview of the market and its different flavours, new supply, investor base, relative value, use of proceeds and central bank policy related to climate risk.
Size of the sustainable covered bond market
Sustainable covered bonds have been issued in different formats, ranging from green, social, and sustainability covered bonds. The different flavours reflect the different use of proceeds of the bonds (please see for more details below as well as the chapter 1.3 and 1.4 of the Fact Book). In short, green covered bonds are mostly aligned with the ICMA’s Green Bond Principles, and sometimes also already with the EU Taxonomy with the proceeds of the bonds being used to (re)finance green projects. In case of covered bonds these are often linked to energy-efficient buildings. Social covered bonds are mostly aligned with the ICMA’s Social Bond Principles. The proceeds of the bonds are used to (re)finance social projects, which in case of covered bonds is largely related to affordable housing or public lending, such as hospitals. Finally, sustainable covered bonds are aligned with the ICMA’s Sustainability Bond Guidelines, which tends to be a mix of green and social projects, for instance, energy-efficiency as well as affordable housing. Green covered bonds form the majority of outstanding sustainable covered bonds, as they had 76% share in total sustainable covered bonds outstanding by the end of June 2023. Social covered bonds had a share of 21% and sustainability covered bonds 3% (see graph below right). The share of green covered bonds has gradually risen over the years, as its share was, for instance, 64% five years ago.
New issuance of sustainable covered bonds gaining momentum
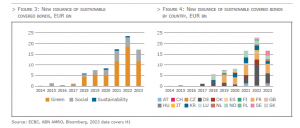
The sustainable footprint of the covered bond market has grown over the years, with new supply having gained real momentum since 2018, setting new records every year. In 2022, new supply of sustainable covered bonds exceeded EUR 20 bn across different currencies for the first time last year. This was almost four times the volume of sustainable covered bond issuance in 2018. In 2023, new issuance was around EUR 17 bn during the first half of the year, implying that the market continues to expand at a solid pace, likely recording a new record in terms of issuance in 2023.
A breakdown by covered bond type shows that the majority of sustainable covered bonds is backed by mortgages (93% of the amount outstanding), with the remaining 7% backed by public sector loans. This mirrors the fact that most sustainable covered bonds are green bonds, financing energy-efficient buildings. Finally, issuers of sustainable covered bonds come from an increasing number of countries. At the start, German and Spanish issuers dominated the market, but currently there are 68 issuers from 18 jurisdictions out of which sustainable covered bonds are being issued (see graph below right). Regarding currencies, the euro is dominant, while there are also AUD, CHF, DKK, GBP, HUF, NOK, PLN, SEK, and USD denominated sustainable covered bonds.
Focusing on the iBoxx euro benchmark covered bond index and taking the June composition, the total amount of sustainable covered bonds in the index equaled EUR 65 bn. This is 7.2% of the total index, which is up from 6% a year ago, and more than double the share two years ago. Of these, EUR 45 bn were green covered bonds (5% of total index). This shows that while sustainable covered bonds were a niche product in the past few years, their share in the index is gradually rising, underlining the importance that covered bonds can play in financing the energy transition. Indeed, the share of sustainable covered bonds in total issuance of euro benchmark covered bonds was just above 10% in H1 2023, which was slightly higher than the 9.6% share in 2022, and above the average share of sustainable covered bonds in the overall index. The clarity that exists on the definition of energy-efficient buildings, and therefore the mortgages that can be financed by green (covered) bonds, is likely to further support issuance of sustainable covered bonds in the coming years.
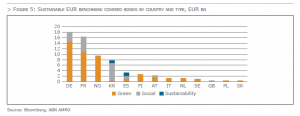
A breakdown by country and type of sustainable covered bond shows that German issuers had EUR 18 bn of sustainable euro benchmark covered bonds outstanding, of which EUR 14.5bn in green and EUR 3.5 bn in social format. They are followed by France, Norway, and South Korea. The latter country had most social covered bonds outstanding, reflecting issuers focus on financing social housing with covered bonds. Sustainability covered bonds were only issued by two countries, having a 3.5% share in total sustainable euro benchmark covered bonds outstanding.
A key reason for issuers to come to the market with covered bonds in sustainable format is that these bonds tend to broaden the investor base, so they can be priced with a premium (or so-called greenium), (see also below). We compared the trading levels of more than 20 green covered bonds versus non-green covered bonds from the same issuer as well as having a roughly similar duration (and all euro benchmarks). This gives a rather pure measure of the greenium. The graph below left shows the results, underlining that green covered bonds indeed trade at a (slightly) tighter levels than their non-green peers, with the average greenium now being around 1.5bp. A split by country (not shown, and limited to Germany, Norway and France) shows that the greenium is largest for Norwegian issuers (around 3bp) and the lowest for German issuers (roughly 0.5bp), which likely reflects that German Pfandbriefe trade already at tighter levels than Norwegian or French covered bonds, which limits the greenium potential.
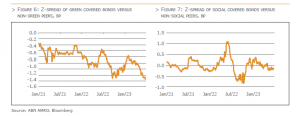
A similar comparison between eight social covered bonds and non-social peers gives a mixed picture, with social covered bonds not always trading tighter than non-social peers. More generally, there seems not to be a large difference between trading levels of social and non-social covered bonds, although recently social covered bonds started to outperform non-social peers. In any case, the ‘social’ premium seems to be lower than the greenium. This probably is due to the bigger size of the green covered bond market as well as clearer definitions about the assets that can be (re)financed by green bonds. The larger investor base for green bonds is also likely factor at play.
SUSTAINABLE COVERED BONDS FINANCE A BROAD VARIETY OF ASSETS
Sustainable covered bonds are mostly issued conform the four pillars of the ICMA’s Green Bond Principles (GBP), Social Bond Principles (SBP) or Sustainability Bond Guidelines (SBG), with a dedicated environmentally sustainable and/or a social use of proceeds. Sustainability linked bonds (SLB) are still a novelty in the banking segment and have thus far not been issued in covered bond format.

A key feature of use of proceeds bonds is that they (re)finance an earmarked portfolio of new or existing eligible green and/or social assets. This portfolio may have an overlap with assets that are eligible as cover pool assets but does not necessarily have to.
The ICMA Principles make a clear distinction between secured green/social bonds where the net proceeds are used to (re)finance sustainable assets that exclusively secure the green/social bonds only (secured green/social collateral bonds) versus those were the (re)financed sustainable assets may or may not secure the specific bond in whole or in part (secured green/social standard bonds).
There are two examples of sustainable covered bonds that meet the definition of secured green/social collateral bond. These include the one single Luxembourgish renewable energy covered bond, and the social covered bonds issued by one of the three South Korean covered bond issuers. All other sustainable covered bonds outstanding would fit into the category secured green/social standard bond.
Within the latter category of bonds, there are sustainable covered bonds that allocate proceeds to a portfolio of sustainable loans that are not part of the cover pool. Separate from their use of proceeds, these sustainable covered bonds are secured by sufficient cover assets meeting the asset eligibility criteria stipulated by law and/or the bond programme documentation.
However, most sustainable “standard” covered bond issuers would generally strive to have sufficient eligible green and/or social loans in the cover pool to at least match the amount of sustainable covered bonds outstanding. For that reason, these loans not only have to meet the criteria stipulated in the sustainable bond framework, but also the asset eligibility criteria under the respective covered bond legislation or programme documentation. It is important to bear in mind that sustainable and vanilla covered bonds issued against one cover pool do have the same preferential claim on both the sustainable and non-sustainable assets that are part of the cover pool.
There are banks that issue both green and social covered bonds against the same cover pool, either under one single sustainability bond framework, or via separate green and social frameworks. In turn, there is also an example of a covered bond issuer that issues both social public sector covered bonds and social mortgage covered bonds via the same social bond framework. Moreover, proceeds can be assigned to a distinct portfolio of assets per bond, or to a broader portfolio of sustainable assets (re)financed by multiple sustainable (covered) bonds.
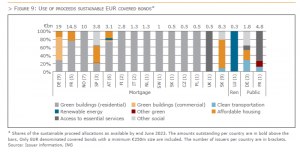
Green mortgage covered bonds primarily finance energy-efficient commercial or residential buildings (66% of all use of proceeds), with green residential real estate loans being the most important use of proceeds category (50%). Instead, banks with mortgage cover pools (partly) comprised of social housing loans often issue social or sustainability mortgage covered bonds (19% of all use of proceeds).
Access to essential services is the most important use of proceeds category for sustainable public sector covered bonds (5% of all use of proceeds). Public sector covered bonds were at first solely issued in social format to finance community projects in areas of healthcare and education. However, there are nowadays also a few public sector covered bonds outstanding with a green use of proceeds, (re)financing among others clean transportation projects (2% of all use of proceeds).
The one single renewable energy covered bond issued under the Luxembourg covered bond law in 2020, remains up until today the one single example of a sustainable covered bond issued under a dedicated legal framework for the issuance of green covered bonds. It is also the only sustainable EUR covered bond printed outside the traditional mortgage and public sector segments.
Matching the use of proceeds with the sustainable development goals
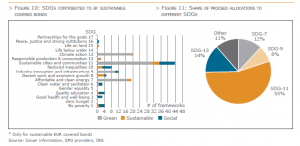
Sustainable covered bonds generally aim to contribute to the achievement of the sustainable development goals (SDG) drafted by the United Nations in 2015. Bonds with a green use of proceeds have a somewhat narrower range of SDGs they support than bonds promoting social purposes. Sustainable cities and communities (SDG 11) is the best sponsored sustainable development goal.
While most sustainable bond frameworks do give an indication of the SDGs they support per use of proceeds category, only few banks would report the exact bond proceed allocations to the dedicated SDGs. We tried to quantify the sustainable covered bond proceed distributions to the different SDGs by matching (pro-rata) the reported allocations per use of proceeds category with the different SDGs listed for the specific use of proceeds. This leads to the indicative conclusion that 55% of all sustainable covered bond proceeds is concentrated on the support of SDG 11, followed with a substantial margin by SDG 13 – climate action (14%), SDG 7 – affordable clean energy (12%), and SDG 9 – industry innovation and infrastructure (8%). The remaining 11% is spread across the other SDGs, except for SDG 2 – zero hunger, SDG 5 – gender equality, SDG 14 – life below water and SDG 17 – properties for the goods.
Which SDGs are in fact promoted by the different use of proceeds categories is open to debate. Some second party opinion (SPO) providers, such as Sustainalytics and ISS ESG, give an indication of the SDGs they believe are sponsored via the green, social or sustainability bonds frameworks they review. Sometimes these SPO providers do come to a slightly different conclusion on the SDGs supported than the issuer itself in its sustainability bond framework.
Use of proceeds and the environmental Taxonomy objectives
Covered bonds with an environmentally sustainable use of proceeds also often strive to contribute to at least one of the six environmental objectives set by the EU Taxonomy regulation, with the climate change mitigation objective so far being the most important one (see chapter 1.3 for further details).
THE RELEVANCE OF SUSTAINABILITY RATINGS
In the past number of years ESG criteria have been increasingly integrated in issuer and covered bond rating methodologies (see Chapter 4 about Rating Agencies). In these cases, ESG aspects are considered to the extent that they impact the credit risk of an issuer or bond. However, there are also external reviewers that assign banks an ESG rating or score purely based upon their environmental, social and governance performance. Moreover, issuers can obtain an external assessment of their green, social or sustainability bond process. The ICMA identifies four types of these bond related reviews:
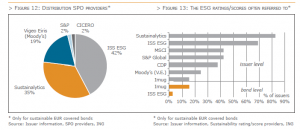
Ahead of issuance, sustainable bond issuers often rely on a second party opinion of the applicable sustainable bond framework. This means that an independent institution assesses the quality of the framework and verifies whether the green/social or sustainability bond is aligned with the relevant green/social or sustainability bond principles. Sustainalytics provides the second party opinion for most sustainable covered bond frameworks, together with ISS ESG. The post-issuance verification of the proceed allocations is often performed by an external auditor. In other cases, the appointed SPO provider gives an update of the second party opinion as part of the verification process. While external reviews are currently obtained on a voluntary basis, the pre- and post-issuance review process will become more formalised under the EU green bond standard. The agreed upon European green bond regulation also outlines a registration and supervision framework for external reviewers.
Issuers can also obtain a certification of their green, social or sustainability bonds or frameworks against a recognized external green, social or sustainability standard or label. As such, several green covered bonds are climate bond certified on behalf of the Climate Bond Initiative (CBI) as an assurance of their consistency with the global warming goals of the Paris agreement. The Covered Bond Label of the EMF/ECBC provides a sustainable covered bond label for covered bonds that are, among others, compliant with the Covered Bond Label Convention, and contain a formal issuer commitment to fully use the covered bond proceeds to (re)finance clearly defined environmental and/or social criteria.
Sustainable covered bonds often do not have distinct sustainable bond ratings. Imug is one of the rating agencies that provides such ratings to several sustainable covered bonds, all of which have been classified in the ‘Very Positive’ or ‘Positive’ categories. ISS ESG also provides sustainability bond ratings but has done so for only one sustainable covered bond thus far. This sustainability bond was classified as ‘Approved’ as it exceeded the b- approval threshold.
Of the institutions assigning company level sustainability scores or ratings, Sustainalytics and ISS ESG cover the largest number of sustainable covered bond issuers. Other entities that score some of the existing sustainable covered bond issuers on ESG aspects include MSCI, S&P Global, CDP, Moody’s ESG Solutions and Imug. While investors would generally view ESG scores as important, we don’t find any supporting evidence of ESG ratings explaining the applicable (modest) differences in greeniums within the sustainable covered bond segment. The broad diversity in ESG ratings and scores, and the perceived transparency issues regarding the approaches and methodologies used, may be possible explanations.
To overcome these issues, the European Commission published a proposal for a regulation on the transparency and integrity of Environmental, Social and Governance (ESG) rating activities in June 2023. The proposed regulation aims to improve the quality of ESG ratings through an authorization requirement for ESG rating providers and through rules to protect the integrity and reliability of ESG rating activities. ESG rating providers also face transparency obligations regarding their methodologies, models and key rating assumptions, and regarding disclosures to subscribers.
Investor demand
To date, sustainable covered bonds have generally been significantly oversubscribed in the primary market. Bankers report that a more diverse investor base is looking at these instruments, with both sustainability focused funds (e.g. SFDR Article 8 and 9 funds) and traditional covered bond investors placing orders. This incremental demand has not yet consistently translated into a lower cost of funding for issuers–the so-called “greenium”–partly because accommodative monetary policy had, until recently, kept interest rates close to zero. However, some market participants believe that this wider investor base could support sustainable issuance, for example in times of market correction or in the current rising interest rate environment. Even traditional covered bond investors generally view sustainable issuance favorably. Most have introduced qualitative or quantitative sustainability considerations into their investment policies, and green or social covered bonds tend to meet more of their sustainability objectives. Many investors focus mainly on the issuer’s ESG credentials, rather than on ESG credentials specific to the covered bond. The majority of sustainable covered bond issuers have received second party opinions on the alignment of their sustainability frameworks with the International Capital Market Association’s (ICMA) green, social, and/or sustainability bond principles, while it remains to be seen if the EU Green Bond Standard, once finalized, will be widely adopted in this market.
Investors identify three main sources of concern with respect to the sustainability characteristics of these covered bond programs. The first is the lack of asset segregation, because upon issuer insolvency, eligible green or social assets will be mixed with other non-green assets in the cover pool. This resembles what would happen to investors in standard green use of proceeds bonds, who would have the same claims against the issuer’s insolvency estate as non-green investors. Given most sustainable bond cover pools do not comprise solely eligible green or social assets, they would qualify for secured standard bonds under the ICMA principles and not secured collateral bonds. The second is a lack of liquidity – sustainable covered bonds are generally easy to sell but very difficult to buy. Third is the complexity of disclosure standards relating to sustainability and/or climate-related issues and the risk of misrepresentation by issuers, perceived as greenwashing. While the structural issue of asset segregation will probably not be addressed until we see more exclusively sustainable assets covered bond programmes (i.e. secured collateral bonds), increased issuance volumes could assuage the second concern, and new rules and disclosure standards which aim to enhance transparency and consistency on sustainability-related issues may help with the third.
Central banks and climate change
Climate change brings potential economic and financial risks that are attracting the attention of central banks globally. Over 100 central banks and financial supervisors have joined the “Network for Greening the Financial System” (NGFS), a network focused on managing climate change risk and mobilizing mainstream finance to support the transition toward a sustainable economy.
Central banks have three main areas of focus on climate change:
Climate-related risks could affect the financial system in two ways. Increasing frequency and severity of physical risks, such as wildfires, floods, or hurricanes, may increase losses for banks and insurers. Secondly, transition risk–where climate policies to decarbonize the economy can be costly for firms or create “stranded” assets–for example by making reserves of coal, oil, and gas unburnable, potentially resulting in higher loan losses for financial institutions.
For financial stability purposes, regulators are using scenario analysis, climate stress tests (CSTs), and other tools to assess the financial sector’s vulnerability to climate change, foster higher disclosure, and encourage banks to embed climate risks in their strategy and risk management. Supervisors’ CSTs help identify the main sectors and geographies generating transition and physical risks for banks’ assets and seek to quantify their exposure to these risks. Supervisors are not yet penalizing banks with higher capital requirements for such long-range risks, but they are increasing the pressure on bank management to proactively understand and reduce them. In July 2022, the ECB published the results of its “bottom-up” CST, where the banks themselves formulated the projections, using their own credit and market risk models under scenarios set by the ECB. This required much more work from individual banks but produced more revealing results. The quantitative part of this CST involved a subset of 41 European banks projecting potential losses they would incur under disorderly transition and physical risk scenarios. The banks estimated credit and market losses of about €70 billion on aggregate in the three-year disorderly transition and in the two one-year physical risk scenarios (flood, drought, and heat). Based on these estimates, banks should be able to cover such losses via earnings–representing around 18% of 2021 pre-tax profits annually–without capitalization levels being threatened. However, these estimates likely understate the climate stress losses banks might face in practice. This is because of data limitations, but also the macro assumptions (based on the NGFS scenarios) being relatively benign and the exercise covering only about one-third of total exposures of the 41 banks in the ECB’s CST scope. The CST also points to data and methodological gaps that may impede their ability to effectively measure climate risk, as well as some shortcomings in their climate stress testing frameworks.
The ECB’s stress test is part of a broader supervisory push to move climate risks higher up the risk management agenda for European banks and a wider regulatory push to incorporate ESG risks into the three pillars of the Basel prudential framework. And its results are broadly reminiscent of the results reported by the Bank of England (BoE) in its Climate Biennial Exploratory Scenario, also conducted in 2022. In both cases, supervisors are using the long-term scenarios developed by the NGFS and seek to assess the business model transformations likely to be triggered under different climate change pathways, in addition to the potential credit losses. Both the ECB and the BoE announced that they will not impose additional capital requirements on the back of these stress tests. Nevertheless, we can assume that regulators will use the results to inform their day-to-day supervision, particularly where they identify outlying banks that are particularly unprepared or have poor risk management or data capabilities.
In April 2023 the ECB published for instance its third assessment of European banks’ climate and environmental disclosure progress. The ECB believes that further improvements are urgently needed. Indeed, although banks have in the past year increased their published information, the report shows that the quality of their disclosures is still too poor to meet supervisory expectations. Ongoing initiatives to improve sustainability-related disclosures will likely enhance the quality and the comparability of climate-related information.
Climate change and the transition to net zero are also likely to directly affect monetary policy. First, if the financial system is in a weaker position because of physical risk or stranded asset related losses, this could impair transmission of monetary policy. Second, transition to a hotter planet or a greener economy are both likely to involve large structural changes from today’s macroeconomic environment. These could affect the neutral rate, which guides central banks’ monetary policies. As such, in a world of higher temperatures, labor productivity is likely to be lower and capital accumulation could be impaired by recurrent physical risk events that may damage infrastructure, while households and firms may choose to retain more precautionary savings. On the other hand, the transition to net zero, which will trigger sizeable green innovation could also spur more rapid productivity gains, increasing the neutral rate. Finally, there are clear impacts on price stability, the main focus of central banks’ mandates. As physical risks become more frequent and severe, output and inflation dynamics are likely to become more volatile. Similarly, a quicker transition to net zero via higher carbon pricing or stricter regulations could trigger output fluctuations, when firms need some time to adjust and lead to price shocks.
In July 2022 the ECB announced further steps to account for climate change in its corporate bond purchases, collateral framework, disclosure requirements and risk management, in line with its climate action plan. The ECB decided to tilt its corporate bond holdings toward issuers with better climate performance, to limit the share of assets issued by entities with a high carbon footprint that can be pledged as collateral under its collateral framework, to accept only collateral from companies and debtors that comply with the Corporate Sustainability Reporting Directive, and to further enhance its risk assessment tools and capabilities to better include climate-related risks.
In March 2023 it published its first climate-related financial disclosures, which provide information on its portfolios’ carbon footprint and exposure to climate risks, as well as on climate-related governance, strategy, and risk management. The disclosures show that the corporate bonds held under the CSPP and PEPP are on a “decarbonization” path. This is partly because the companies in its portfolio have lowered their emissions for every million euro of revenue they earn, reflecting their efforts to significantly reduce their emissions and boost carbon efficiency, but also the ECB’s decision to tilt its holdings toward issuers with a better climate performance.
Conclusion
This chapter addressed multiple facets of the sustainable covered bond market. Although sustainable covered bonds remain a niche in the covered bond market, their share has been growing every year. Sustainable covered bonds finance a wide range of green and social loans, often related to energy-efficient buildings, affordable housing and access to essential services. However, due to the tight spread levels of covered bonds, the greenium between sustainable and vanilla covered bonds remains modest and is in some cases not even visible. Meanwhile, the tools available to investors to make a distinction between sustainable versus less sustainable investment alternatives continue to evolve. To name an example, ESG criteria have been increasingly integrated in issuer and covered bond rating methodologies, while issuers also often obtain an external assessment of their green, social or sustainability bond process from external reviewers. Besides, central banks have become more and more involved in climate-related issues. The integration by central banks of climate considerations into their asset portfolios and collateral eligibility criteria, will only form a further positive incentive for investors to buy sustainable assets, including sustainable covered bonds.
by Joost Beaumont, Chairman of the ECBC Statistics & Data Working Group and ABN AMRO & Maureen Schuller, ING & Antonio Farina, S&P Global Ratings


The European Covered Bond Council (ECBC) is the platform that brings together covered bond market participants including covered bond issuers, analysts, investment bankers, rating agencies and a wide range of interested stakeholders.


