14 August 2018


INTRODUCTION AND METHODOLOGY
The ECBC Statistics and Data Working Group has been collecting statistics on the outstanding volume and annual gross supply of covered bonds at year end for 15 years now. From the start its aim has been to provide a complete set of numbers that can serve as guidance for interested parties from issuers and investors to regulators.
The collection of statistics is a significant undertaking each year which is only possible thanks to the cooperation of the Working Group members, covered bond issuers and banking associations. One representative per country (the list of country representatives can be found on the ECBC website) undertakes the initial data collection by approaching each issuer separately in most countries. These figures are then cross checked on the basis of publicly available data by a small number of Working Group members. The 2017 numbers were cross checked by Joost Beaumont from ABN Amro, Agustin Martin from BBVA, Maureen Schuller from ING as well as myself and Hyuck Jong Won.
The aim of the ECBC statistics is to paint as realistic a picture of the actual market and picture relevant trends as accurately as possible. Having changed the methodology slightly for the 2016 statistics by adding the breakdown by maturity structures, we kept the methodology unchanged for the 2017 data exercise.
We have tried in the past and will continue to try to improve the quality of the data even for previous years. It is always possible that we miss a bond or still include a bond that has been repaid early (just think of retained covered bonds). Wherever we realise that there was a mistake in last year’s data we amend the numbers. As a result of this, there are some slight differences in the numbers for 2016 compared to what was published last year. In our view, these adjustments are perfectly normal and we would rather adjust historic data to reflect a more realistic picture than mechanically hold on to data that was once published but proven incorrect.
Before going into the actual statistics, we want to make some general remarks about the figures which are necessary to interpret them correctly:
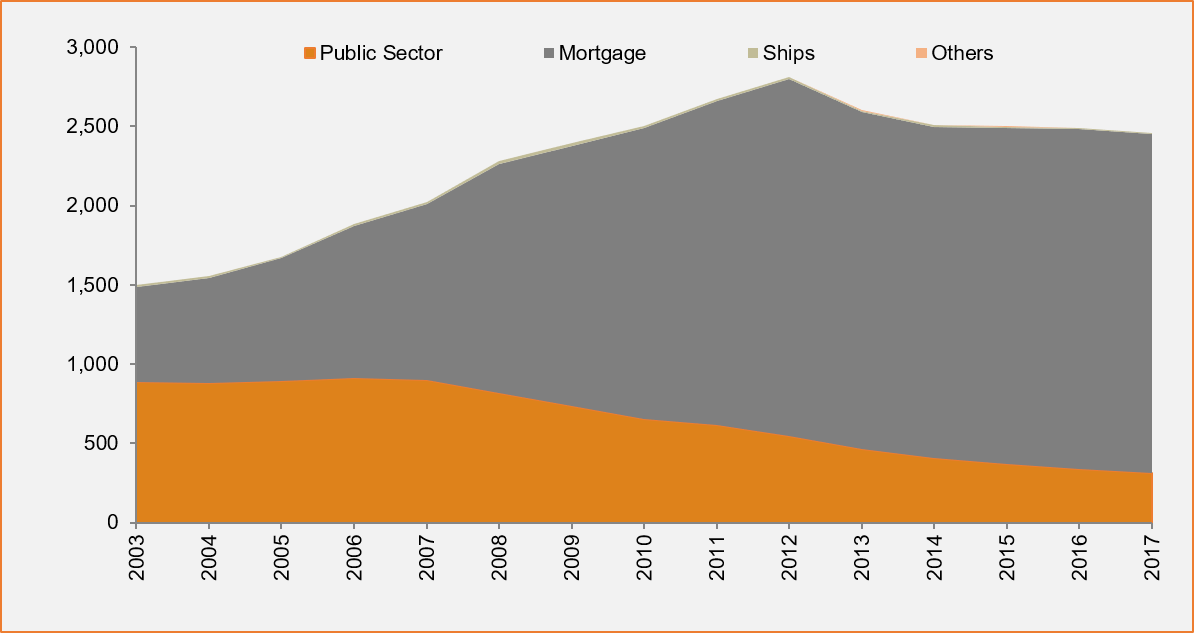
For the fifth year in a row covered bond markets have been shrinking compared to the previous year. As was the case in 2015 as well as 2016, the drop in volumes was, however, barely noticeable. At EUR2,460bn covered bond markets contracted by a mere 1.25% last year after falling by 0.31% in 2016 and 0.35% in 2015. From the top in 2012 (EUR2,811bn) outstanding volumes have fallen by 12%.
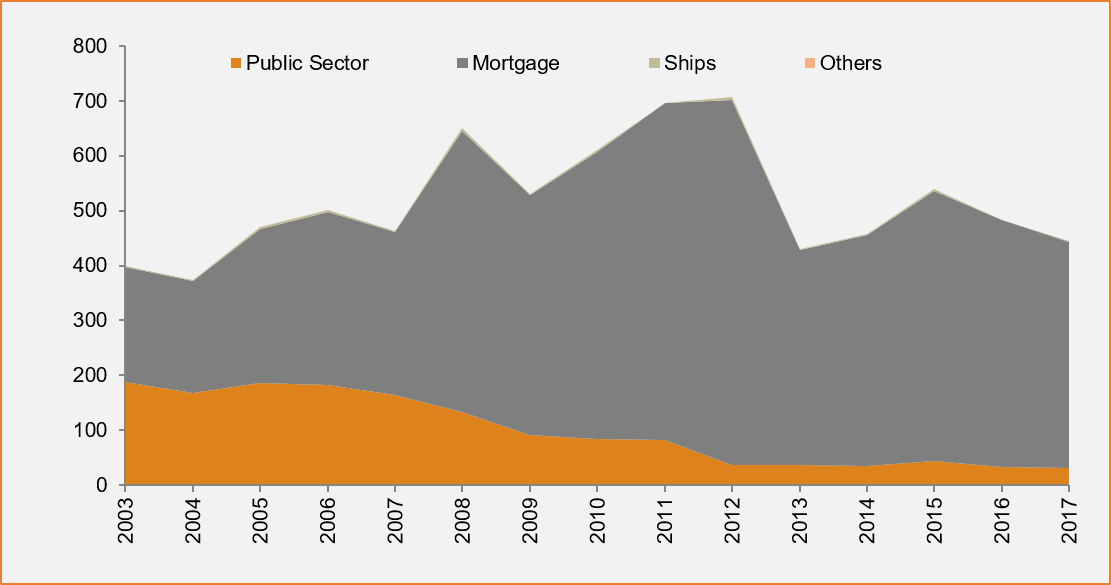
As was the case last year and the year before, the drop was mostly driven by public sector backed covered bonds which contracted by 6.9%. We still have a number of static programmes here that are being run down by the issuers without new issuance taking place. Mortgage backed covered bonds contracted too but by a mere 0.31%. As a consequence their share in the outstanding universe increased to 87% from 86% in 2016. Public sector backed covered bonds represent the second biggest group at 13%. Covered bonds backed by asset classes such as ship (0.3%) or aircraft (0.02%) mortgages continue to be a negligible portion of the overall market.
While we did not have a new market joining the covered bond family (in 2016 we did welcome Turkey), we had to say goodbye to two countries (for now at least). The last outstanding covered bonds matured in Panama as well as the United States. This brings the number of countries that are actively using covered bonds to 29 world-wide. The issuer universe did, however, expand to 316 (which are running 429 covered bond programmes) up from 308 in 2016.
Out of these 29 active countries, 16 saw their market grow in 2017, 12 registered falling volumes and volumes remained unchanged in one country.
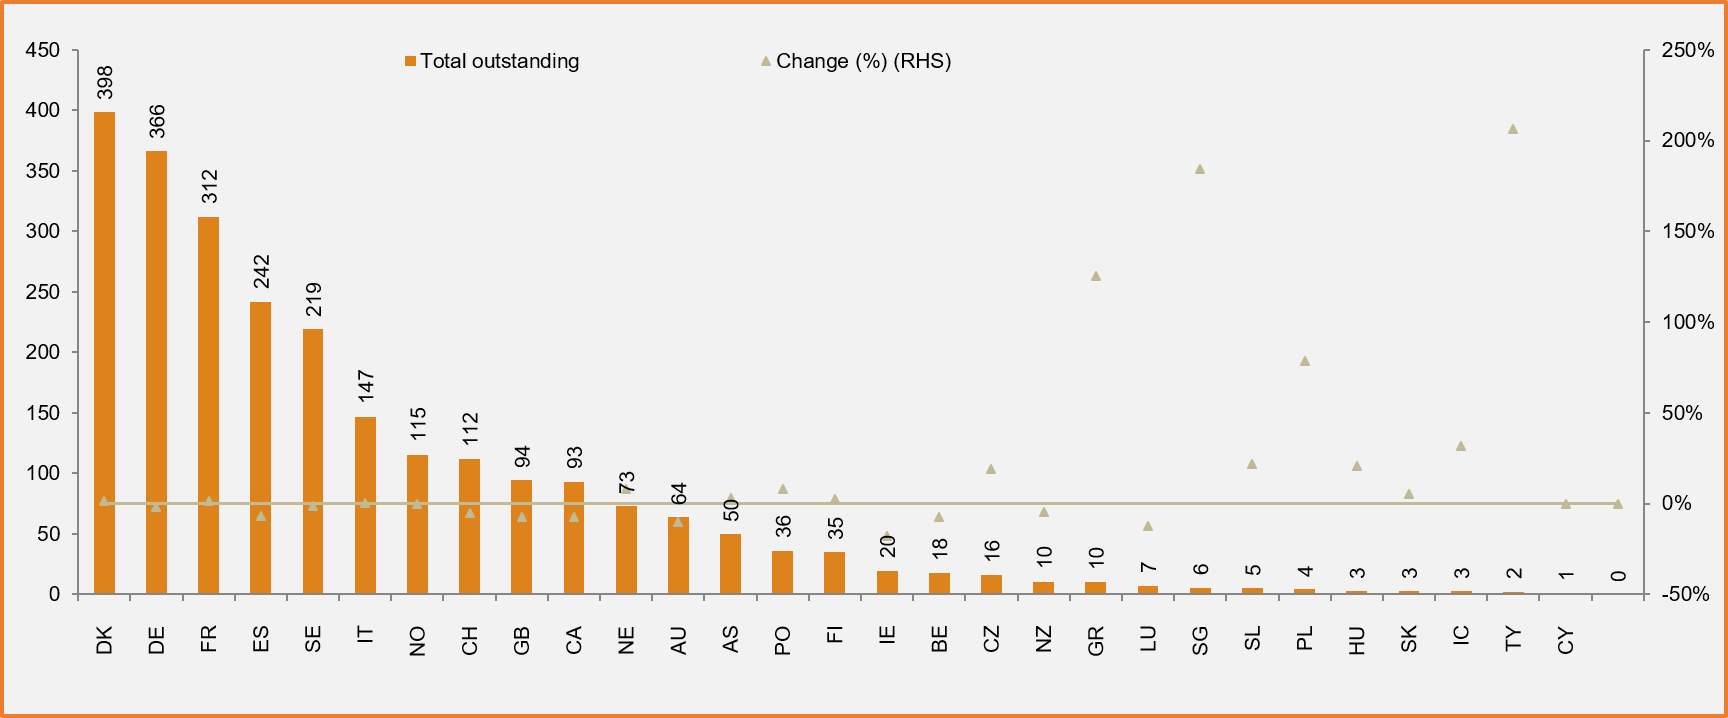
Looking into more detail at the country level shows some familiar themes but also some trends that we did not see in 2016. The country with the most pronounced contraction in outstanding volumes was again Spain (down by EUR17bn or 7%). German covered bonds did also contract (down by EUR8bn or 2%), mostly driven by the above mentioned trend in public sector backed covered bonds. What is new is that for the first time since their inception, Australian and Canadian covered bond markets contracted by around EUR7-8bn each. While in the case of Canada, the bulk of the change was down to EURCAD fluctuations (CAD totals remained virtually unchanged), Australian volumes fell in EUR equivalent as well as AUD terms as issuers focused on other funding products than covered bonds. After years of non-EU covered bonds gaining ground, EU based covered bonds thus marginally increased their share in the overall covered bond universe from 83% in 2016 to 83.5% in 2017.
Looking at the ranking of countries by size, we only had one position change in the top ten as Norway (up from 8 to 7) and Switzerland swapped positions. Just outside the top ten, the Netherlands and Australia swapped places with Dutch covered bonds moving from 12th to 11th position. Towards the bottom of the ranking we had somewhat more movement with Singaporean covered bonds moving up by 5 positions to reach 22nd spot while Korean covered bonds fell three positions to 26th.
As a consequence, Denmark (EUR398bn) still occupies first position ahead of Germany (EUR366bn), France (EUR312bn) as well as despite the drop in volumes Spain (EUR242bn).
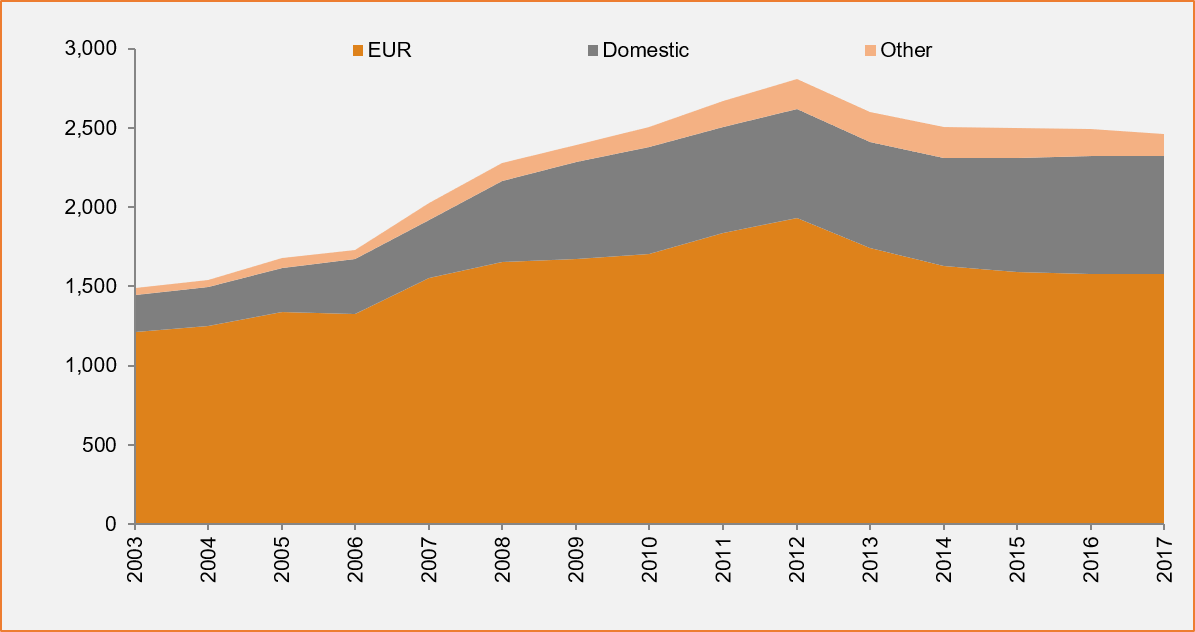
Outstanding covered bonds by collateral type (LHS) as well as currency (RHS) in EURbn
 |
 |
|---|
Outstanding covered bonds by country as well as change vs. 2016 (EURbn)
 |
|---|
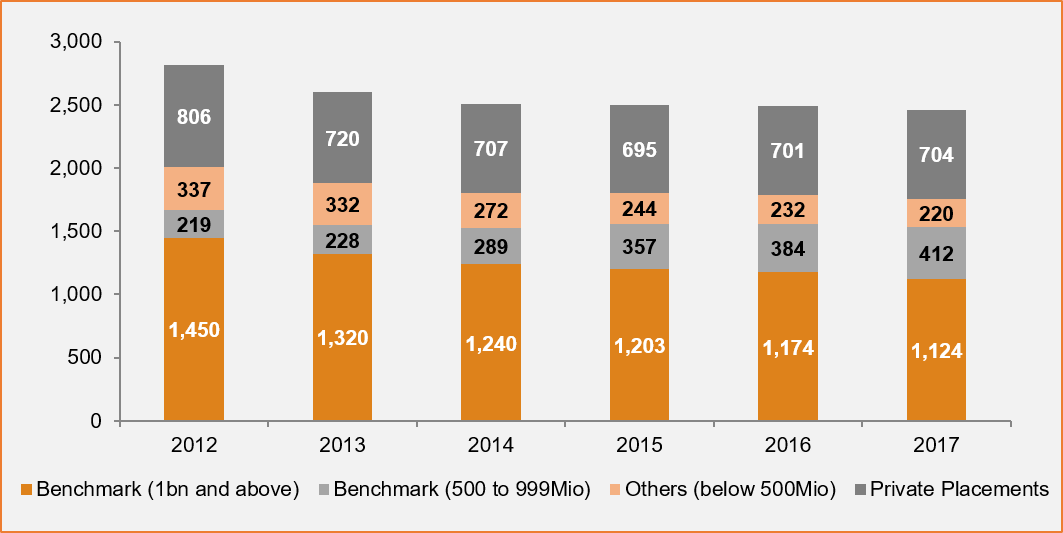
We have had some major swings in the breakdown by placement type over the years. Having seen a big surge in volumes as banks in a number of countries used retained covered bonds as repo collateral during the crisis, the private placement category saw a big drop in 2013 (-85bn or 11%) as European lenders paid back part of their LTRO money and consequently cancelled out retained covered bonds. In 2015 this category stabilised and the same can be said for 2016 and 2017. The main change compared to 2016 was a slight drop in the EUR1bn and above category (down by 4.3% or EUR50bn) while the EUR500-999m category saw an increase by around 7% or EUR28bn. This category now accounts for 16.8% of the overall market after 15.4% in 2016.
Outstanding covered bonds by issue type (LHS) as well as by coupon type (RHS) in EURbn
 |
tesr | 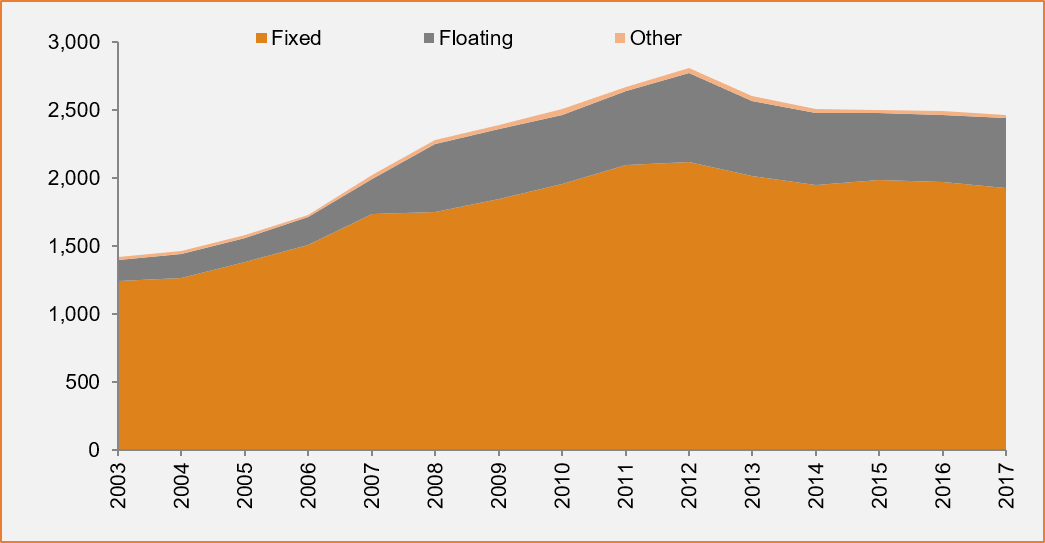 |
Covered bond markets continued to be dominated by fixed rate bonds. Despite the low interest rate environment this coupon type continues to make up 78% of the market (slightly down vs. 2016 by 0.7%).
Outstanding volumes of floating rate covered bonds did move up by EUR21bn in 2017 with the share increasing by 1% to 21%. After all one would think that in the current interest environment there is demand from for example money market funds as well as bank treasuries for highly rated floating rate covered bonds. And in markets such as the GBP covered bond market, much of the growth in 2017 and especially 2018 has indeed been driven by floating rate note covered bonds. Especially in EUR markets, however, Euribor levels are still so low that issuers would need to floor coupons at 0%, which has limited interest. As a consequence, much of the floating rate covered bonds are predominantly either from domestic covered bond markets in the Nordics or the UK or they are retained bonds used for repo purposes in EUR space.
Looking at the breakdown by currencies, a slight contraction in EUR (down by EUR3bn) was offset by growth in domestic currencies (up by EUR4bn). The biggest drop came from covered bonds denominated in other currencies (down by EUR32bn). This mostly corresponds with the drop in outstanding volumes in countries such as Australia and Canada mentioned above since issuers from those countries have in the past been the most active names in non-domestic and non-EUR currency markets such as USD.
After EUR540bn in 2015 and EUR484bn in 2016, issuers across the globe printed EUR445bn new issuance in 2017. This is the second year in a row that issuance volumes have dropped compared to the previous year.
The dominance of mortgage backed covered bonds mentioned above in the context of outstanding volumes is even more pronounced when it comes to new issuance. While public sector backed covered bond issuance represents a mere 7%, mortgage backed covered bond issuance represents 93% of overall issuance.
Covered bond new issuance by collateral type (LHS) as well as currency (RHS) in EURbn
 |
tesr | 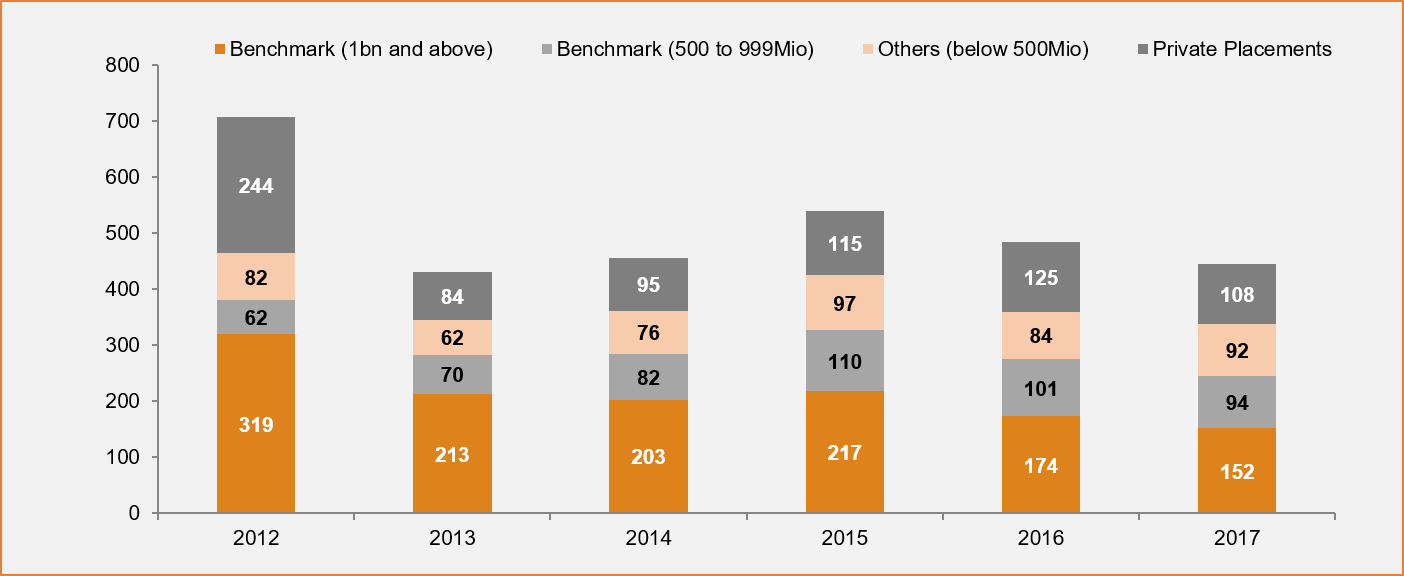 |
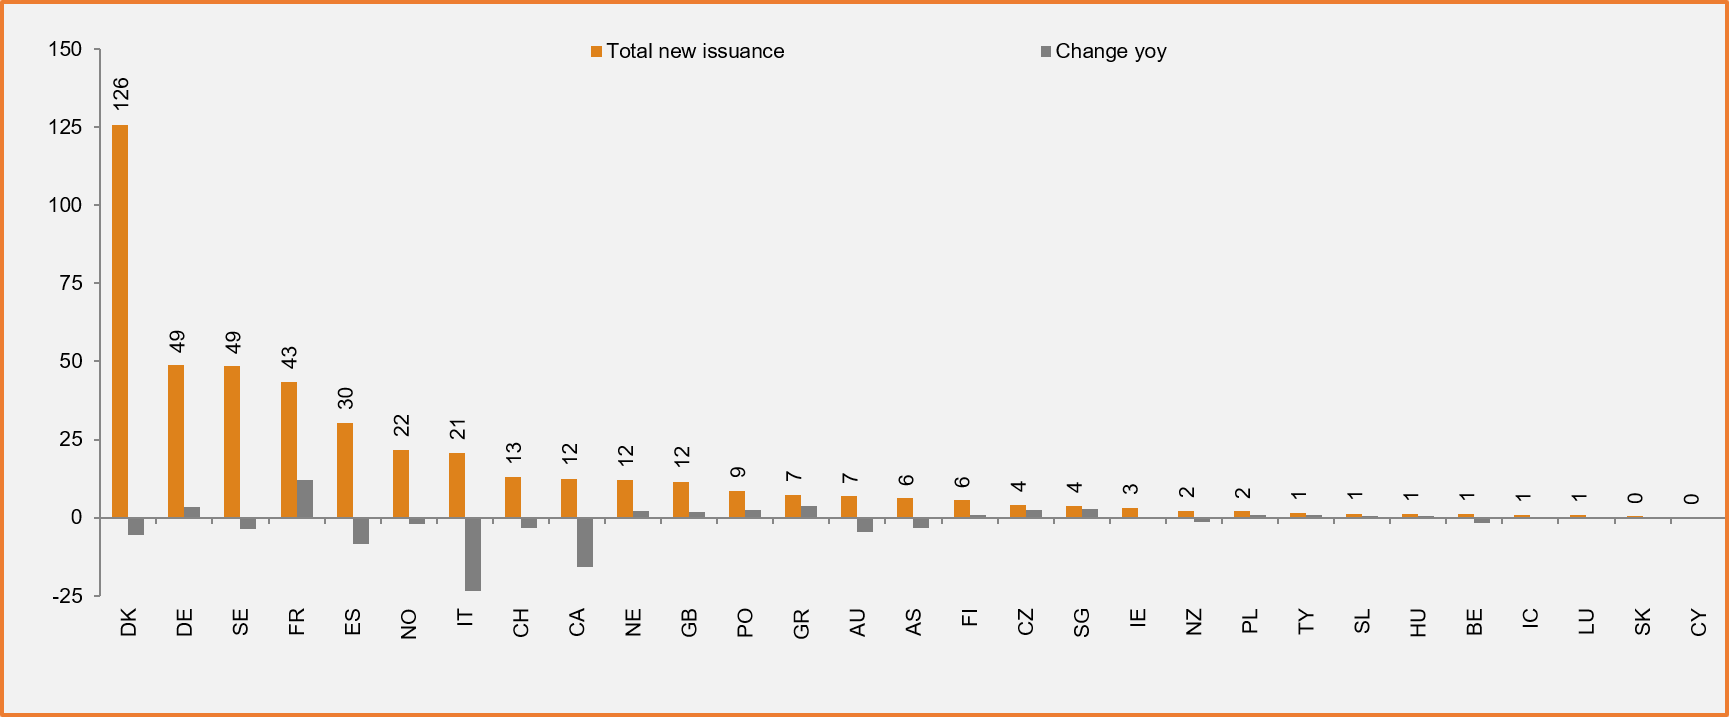
Covered bonds new issuance by country as well as change vs. 2016 (EURbn)
 |
|---|
Denmark is still by far the country with the largest new issue volumes (EUR126bn). Having seen issuance drop the most out of any country in 2016, Danish issuance volumes have, however, stabilised in 2017. At EUR49bn each Germany and Sweden follow the Danes as the second and third largest countries for new issuance. The country with the biggest increase in issuance compared to 2016 was France that saw issuance volumes rise by EUR12bn to help the country secure fourth spot with EUR43bn in issuance. Italy on the other hand saw issuance volumes drop by more than half to EUR21bn. In 2016, issuers had still issued sizeable volumes of retained covered bonds to use as repo collateral for the TLTRO II. This factor was not there anymore in 2017.
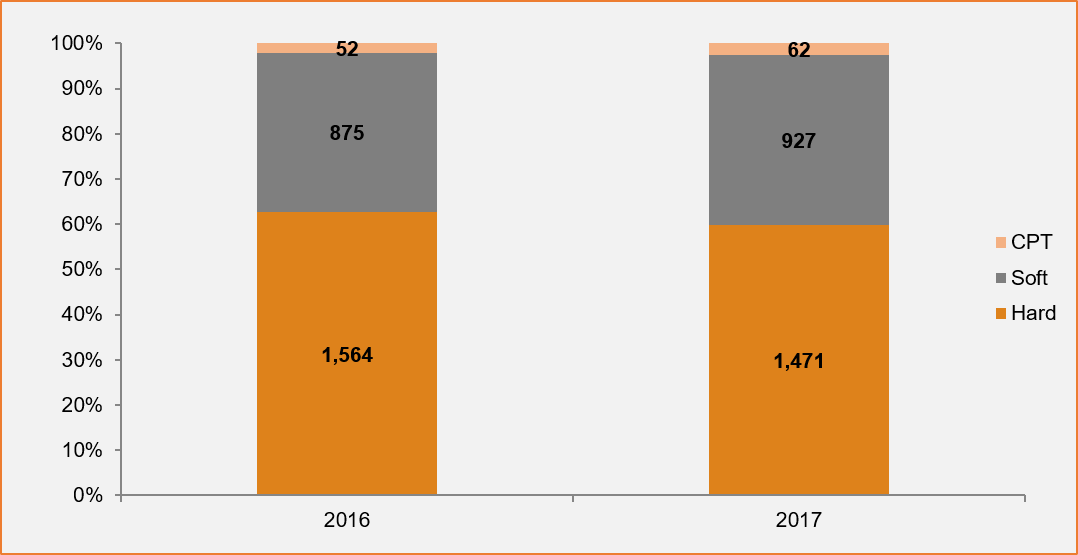
In the past two years, a lot of attention has been placed on maturity structures. As a consequence, we did add maturity structure breakdowns to the ECBC statistics in 2016. Especially conditional pass through (CPT) covered bonds have been in the focus of authorities (especially the ECB) but also on soft bullets and the trigger mechanisms for the extension has been an actively discussed topic in the context of the covered bond harmonisation debate.
Looking at the 2017 statistics shows that CPT structures are a niche product. Outstanding volumes did move up by EUR9bn. At EUR61bn they still only represent around 2.5% of the overall market and their share in new issuance dropped from 5% in 2016 to 4% in 2017. Soft bullet covered bonds on the other hand are continuing their trend to become the dominant maturity structure in the market. Looking at outstanding volumes, they only represent 38% (up from 35% in 2016). In terms of new issuance they are, however, already in the majority (52%). Considering that amongst the fastest shrinking markets Spain and Germany use hard bullets, this trend is unlikely going to reverse.
Breakdown of covered bonds outstanding (left) and new issuance (right) by maturity type (%)
 |
tesr | 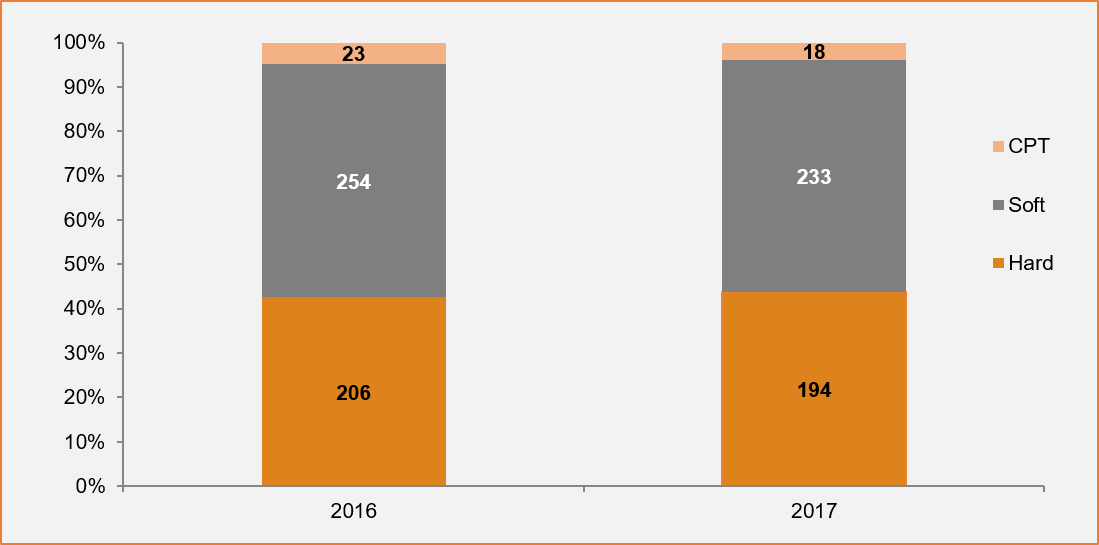 |
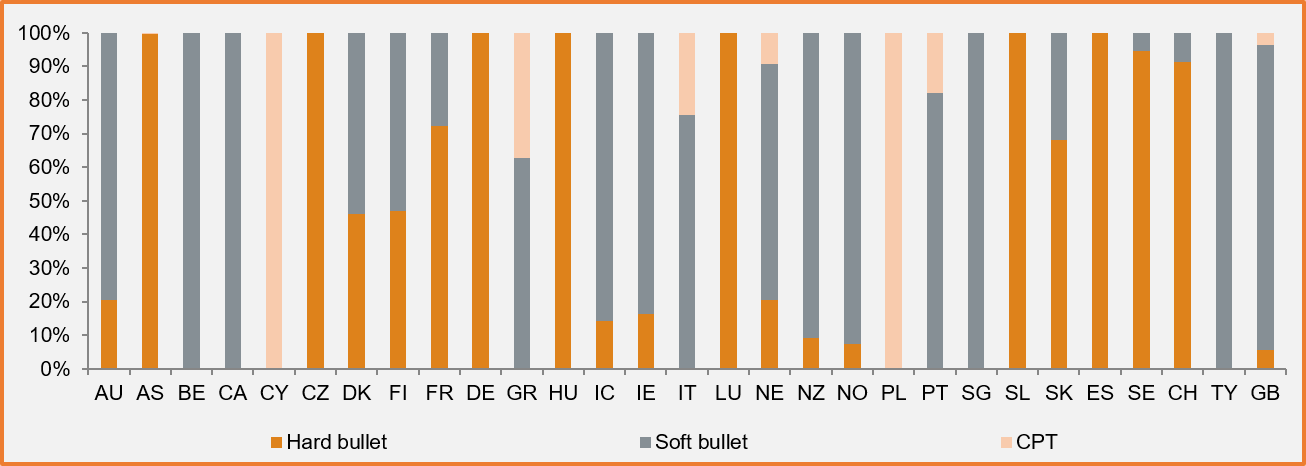
Breakdown of covered bonds outstanding by maturity type (%)
 |
|---|
2018 has been a rather interesting year in primary markets. It started very busy with Q1 EUR benchmark volumes reaching EUR49bn despite very tight spreads. At that time, market consensus was still for a drop in new issuance vs 2017 on the back of a marked drop in redemptions as well as issuers focussing more on funding products such as non-preferred senior as well as maintaining their central bank exposure. We also saw the CBPP 3 continue to operate with sizeable orders in new issues early in 2018. This added to the perception on the investor side that while levels were really tight vs swaps as well as other asset classes, early 2018 new issuance was the only way to invest in covered bond markets. Thanks to the CBPP 3 secondary markets were, after all, not the place to move positions in a meaningful way.
All of this changed in mid-March, however, as the Eurosystem started to drop their order sizes in primary markets from around half of the targeted issue size to around 40%, then to around 30% and most recently to around 20-25%. This in turn led to issuers becoming fairly nervous and the result was the highest April and May new issuance volumes in a very long time. Investors also adjusted their behaviour as they raised their issuance projections upwards and pushed issuers to substantially raise new issue premiums. The re-pricing that the market had been waiting for quite some time in the context of the CBPP 3 taper thus happened well before the end of QE net additions and was driven by new issuance. Even core covered bond sectors moved wider by up to 20-25bp. Markets that did not see issuance volumes on the other hand continued to move sideways at unrealistically tight levels with the only participants active being the Eurosystem. The last market to finally see issuance and thus re-price was Italy right before the summer. This still leaves above all Spanish covered bonds that have seen a mere EUR3bn of benchmark issuance so far in 2018 and spreads barely moving.
At the end of July we stand at EUR98bn in EUR benchmark markets. Since redemptions have fallen quite substantially this in turn pushed net issuance from a negative EUR18bn in the first seven months of 2017 to a positive EUR29bn.
Between now and year-end issuance will be driven by a number of factors. Covered bond benchmark redemptions will grow from a multi-year low in 2018, so will especially Eurozone issuers chose to pre-fund 2019 covered bond needs while the CBPP 3 is still adding volumes in net terms? Redemption reinvestments will be a major force going forward but they will be substantially higher in 2020 and 2021 than in 2019. At the same time, issuers will have to decide for themselves whether starting to repay the TLTRO II money early is worth it or whether they want to keep holding on to the money. So far we have only seen EUR11bn being repaid in June. The first tranche will, however, lose half of its NSFR benefit June next year, so there are incentives to act early. In addition to this, by year-end, issuers from all EU countries will have a non-preferred senior funding tool at their disposal. There will thus be more competition for covered bonds. And then there is still the good old senior preferred debt that should not be forgotten. In times when spreads to covered bonds are as low as 20bp or less, all-in funding costs actually favour senior debt over covered bonds.
Looking beyond EUR benchmark markets, GBP space has seen volumes surge in 2018. At GBP12.5bn by end July volumes have easily surged past full year 2017 figures. Currency basis moves making USD issuance less attractive have certainly helped as has a lot of interest from UK money market funds and bank treasuries for highly rated floating rate assets. USD markets in turn have barely moved in 2018 as the basis move coupled with less activity from some of the largest USD covered bond issuers have hampered volumes. As of the end of July, USD benchmark covered bond issuance has reached a meagre USD4.7bn.


The European Covered Bond Council (ECBC) is the platform that brings together covered bond market participants including covered bond issuers, analysts, investment bankers, rating agencies and a wide range of interested stakeholders.


