28 October 2020


Joost Beaumont, Chairman of the ECBC Statistics & Data Working Group, ABN AMRO Bank N.V
The ECBC Statistics and Data Working Group has been collecting statistics on the outstanding volume and annual gross supply of covered bonds since 2003. The aim is to provide a complete and consistent set of numbers that can serve as a reliable source of data for interested parties, ranging from issuers to investors and regulators. The past eight years, Florian Eichert was responsible for the data collection, which justifies a big thank you.
The collection of statistics is a significant undertaking each year, which is only possible thanks to the cooperation of the Working Group members, in close cooperation with covered bond issuers and banking associations. One representative per country (the list of country representatives can be found in the list of author section at the beginning of the Fact Book) undertakes the initial data collection by approaching each issuer separately in most countries. These figures are then cross checked on the basis of publicly available data by a small number of Working Group members. The 2019 numbers were cross checked by Florian Eichert and Nofal Shezad from Crédit Agricole, Agustin Martin from BBVA, Karsten Rühlmann from LBBW, Maureen Schuller from ING, as well as myself. A special thanks also goes to Daniele Westig of the ECBC for all his support during the exercise.
GENERAL REMARKS ON THE 2019 STATISTICS
The aim of the ECBC statistics is to provide the most reliable data on the size and issuance of covered bonds globally. As such, it paints as realistic a picture of developments and trends in the covered bond market. In 2016, a breakdown by maturity structures was added to the statistics, while this year, we started to collect statistics on sustainable covered bonds, reflecting their rising importance. Having said that, we will not publish this data yet on a country-by-country level, but rather provide a comprehensive overview in this article. Besides including data on sustainable covered bonds, the methodology was kept unchanged for the 2019 data exercise.
As always, we continue to try to improve the quality of the data even for previous years. It is always possible that we miss a bond or still include a bond that has been repaid early (just think of retained covered bonds). Wherever we realize that there was a mistake in last year’s data we amend the numbers. As a result of this, there could be some slight differences between this year’s numbers and those published in previous years.
Before going into the actual statistics, please find below some general remarks about the figures, which should help to interpret them correctly:
> Covered bonds are divided into those denominated in euro, those in domestic currency (if not the euro), and those in a currency other than the euro and the domestic currency. The tables are all in euro, with the end-of-year exchange rates published by the European Central Bank used to convert all non-euro denominated figures into euro for the respective year. This adds an exchange rate component to the volumes of non-euro covered bond markets. However, the aim is to show volumes that allow a potential investor to get a feel for the relative size of the various countries rather than the funding volumes obtained by issuers, which typically are swapped back into their domestic currency at issuance.
> Another breakdown is the public placement of covered bonds, which splits the bonds by their size (EUR1bn and above, EUR500m – below 1bn, below EUR 500m). This is to provide a feeling for how large liquid benchmark markets are relative to the overall market size. For non-euro issuance we have introduced waivers, as for example USD500m is a benchmark size in USD markets but when converting it to EUR would fall into the EUR<500m bucket. The amounts relevant for the three buckets are as follows.
AUD: AUD1bn, AUD500m, AUD<500m
USD: USD1bn, USD500m, USD<500m
GBP: GBP500m, GBP250m, GBP<250m
> For the purpose of counting the number of issuers and of new issuers the following applies: 1) Issuers are entities with at least one outstanding covered bond at year-end. 2) Issuers with multiple programmes still only count as one. The only exception to this rule is French covered bonds. In case of France, the actual issuer is a specialised bank rather than the mother company. As a result, one mother company with two covered bond programmes also counts as two issuers as the issuance actually comes from two separate legal entities. 3) New issuers are entities with at least one outstanding covered bond at year-end, but with no outstanding covered bond at the prior year-end.
> Spain: Spain’s covered bond statistics are based on the data provided by Spain’s AIAF (Asociación de Intermediarios de Activos Financieros). We have complemented this with registered unlisted covered bonds from the ECBC Covered Bond Label Database. The breakdown into public and private placements as well as the breakdown into fix and floating coupons in Spain is entirely based on non-AIAF sources.
> Sweden: Sweden’s covered bond statistics exclude retained transactions used for the purpose of accessing central bank liquidity, and include only converted bostadsobligationer (mortgage bonds) and säkerställda obligationer (covered bonds).
FACT BOOK VERSUS LABEL STATISTICS
Before turning to the results of the exercise, we like to highlight the relation between the fact book statistics and those published by the ECBC Covered Bond Label. The Label has become a widely used tool with 115 issuers disclosing information on 140 cover pools across 21 countries by 30 September 2020 and covers EUR 2tn of covered bonds, i.e. over 70% of the total outstanding market. When comparing the Covered Bonds listed in the Label statistics to those presented in the Fact Book there might be some discrepancies, especially regarding public-private classification in Denmark and Sweden.
The reason for these discrepancies is the different market structure those two countries have where bonds are frequently tapped, repurchased and then tapped again. The Label as well as the ECBC statistics definitions requires a bond to be listed as well as syndicated to be classified as public. Although Danish and Swedish covered bonds are listed, the way they are issued does not comply with the syndication requirement. In the ECBC statistics presented below we try to capture the ”liquid” part of the market with our classifications and in justified cases can be more flexible than the Covered Bond Label database. We have therefore tried to eliminate the differences between both data sets wherever possible. But we have granted Denmark and Sweden an exception and consider bonds that for the ECBC label database are classified as private as public as long as we are talking about liquid benchmarks by these two countries’ standards.
POSITIVE TREND CONTINUED IN 2019 – OUTSTANDING AMOUNT SECOND-HIGHEST EVER
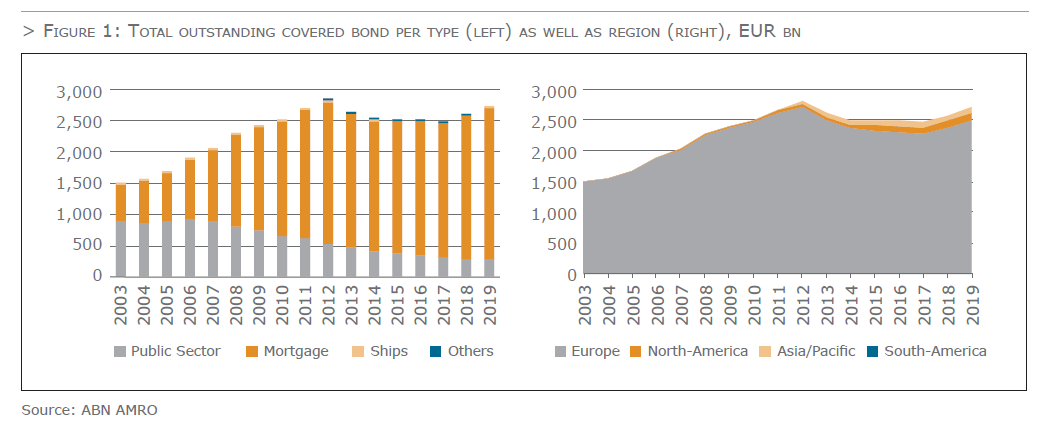
The outstanding amount of covered bonds continued its positive trend in 2019. The market grew by 5.0% in 2019, following 4.7% growth in 2018. In fact, the EUR 2.7tn of outstanding covered bonds is the highest since 2012, and the second-highest ever. As such, covered bonds confirmed their role as a very important funding tool for banks across the globe.
The growth in the outstanding amount of covered bonds was largely due to an increase in mortgage backed bonds (+6.1%), as the volume of public sector backed covered bonds dropped by 3.8%. However, the latter was mainly due to large redemptions, given that issuance of public sector covered bonds actually increased substantially (see below). The outstanding amount of covered bonds backed by ship loans grew by 35.1% in 2019, although this market remains a niche, with only EUR 8.8bn outstanding. Overall, mortgage backed covered bonds have a share of 89.2% in the total amount outstanding, followed by public sector backed covered bonds (10.5%), and those backed by ships (0.3%).
A new record has been set in terms of the total number of covered bond issuers. At the end of 2019, there were 329 covered bond issuers, which was the highest number ever, comparing to 141 issuers in 2003 and 325 issuers in 2018. Overall, there have been over 300 covered bond issuers for 10 years now. Worth mentioning is that from the 12 new covered bond issuers 3 were from South Koreawhich joined the (domestic) covered bond market. Meanwhile, no new countries joined the covered bond market, although issuers from Slovakia issued their first benchmark sized covered bonds in 2019. As a result, the number of countries with outstanding covered bonds remained at 32 in 2019. Furthermore, there were 439 covered bond programmes at the end of the year, up from 436 in 2018, as some issuers have public sector as well as mortgage covered bond programmes while some are using multiple mortgage backed ones.
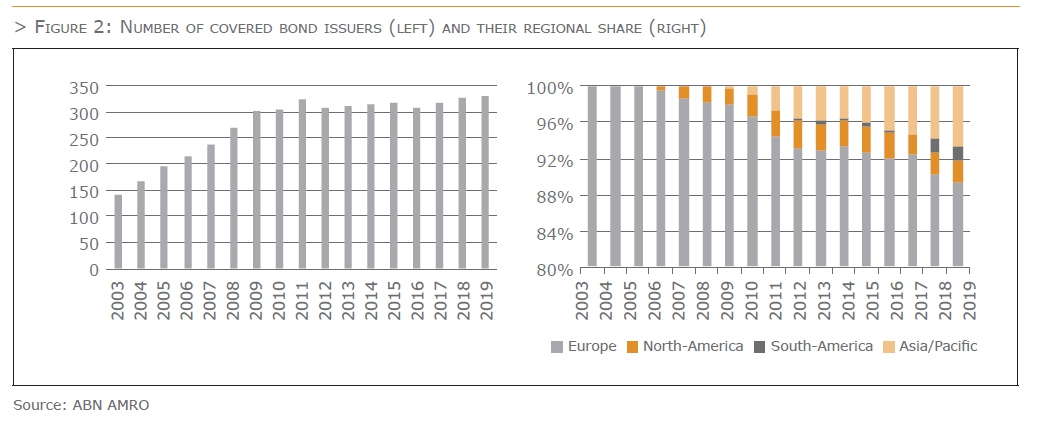
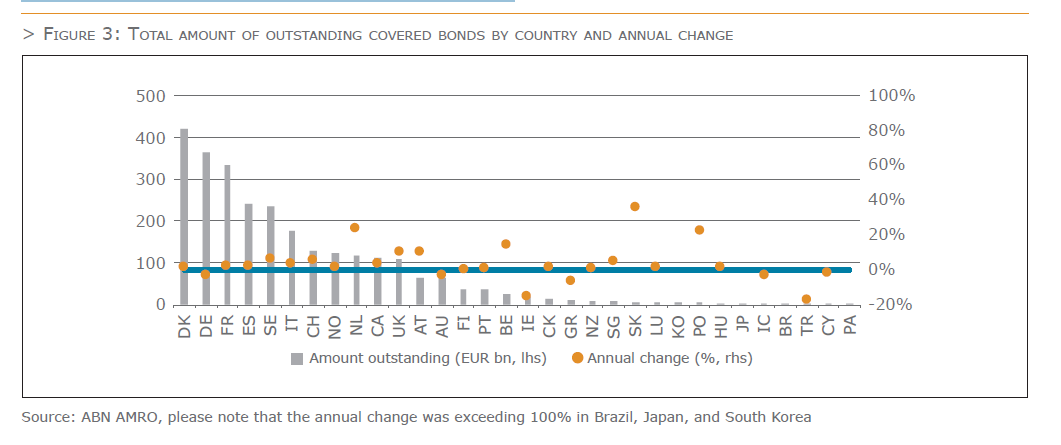
A breakdown by country shows that only six out of the 32 countries saw a decline in the outstanding amount of covered bonds. This number was still lower than the average of 10 shrinking markets in the past ten years. The regional split also revealed the ongoing globalisation of covered bonds, as the share of outstanding covered bonds issued outside Europe increased to 7.7%, a 12bp increase compared to last year. Overall, Europe has a 92.3% share in the outstanding volumes, Asia/Pacific 3.5% and the Americas 4.3% (due to rounding the total is 100.1). In terms of annual growth, the figures are 4.9%, 6.3%, and 7%, respectively.
Zooming in on specific countries shows that the German market, which grew last year for the first time since the series began, shrank again last year (-1.5%), with a drop in outstanding public sector covered bonds being
the main reason, as outstanding mortgage Pfandbriefe actually increased. Furthermore, there were 15 countries that grew by more than 5% in 2019, with Denmark, France, the Netherlands, Sweden and the UK markets growing with more than EUR 10bn each. Finally, 16 countries had the highest outstanding amounts at the end of 2019 since the start of the series ion 2003.
The top three country rank by size did not change in 2019, with Denmark (EUR 419bn) still taking the top spot, followed by Germany (EUR 364bn) and France (EUR 334bn). However, there were some changes within the top ten. Switzerland and Norway changed position, with Switzerland now ranking 7th and Norway 8th. Meanwhile, the Netherlands entered the top ten at place 9, gaining two spots compared to 2018. It pushed Canada from 9th to 10th place, while the UK dropped out of the top ten. Meanwhile, South Korea achieved the biggest improvement by moving up three ranks to 24th place.
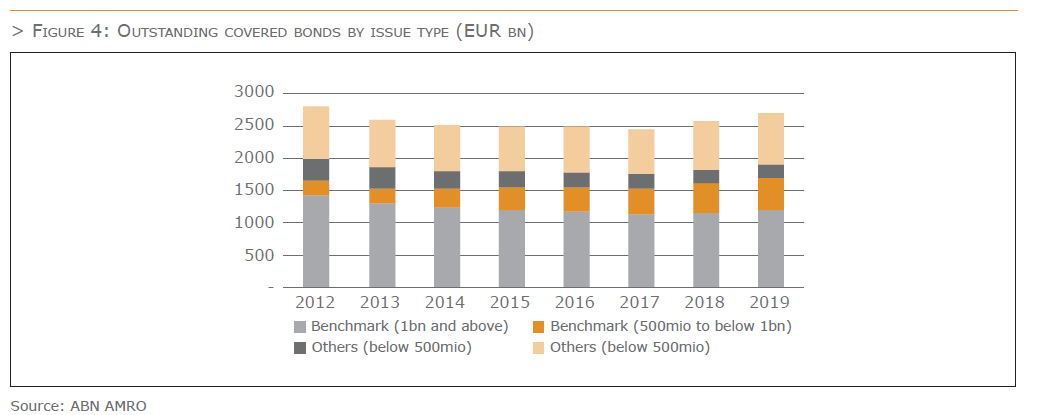
Turning to the breakdown by public and private placements shows that 29% of outstanding covered bonds was privately placed. The majority is publicly placed, with the market of benchmark bonds above EUR 500mn growing by EUR 91bn in absolute terms. Half of the increase stemmed from benchmark bonds with a size between EUR 500 and below EUR 1bn, with the other half being benchmark bonds with a size of EUR 1bn and above. However, the percentage growth was largest in the bucket EUR 500mn – below EUR 1bn, continuing the trend seen in recent years.
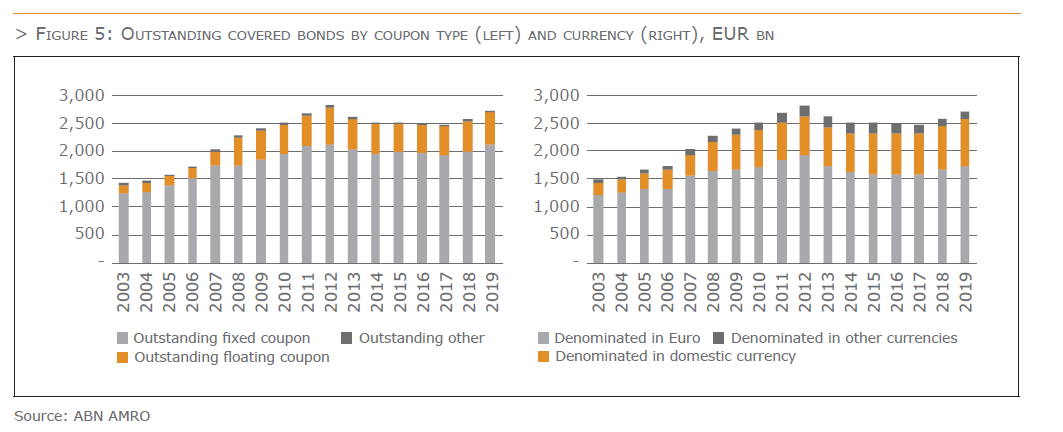
The breakdown of outstanding covered bonds by coupon type as well as by currency type remained fairly stable in 2019. The fixed rate coupon remained the standard (78%), reflecting that almost all publicly placed benchmark covered bonds in EUR have a fixed coupon. Floating rate covered bonds kept a share of 21% last year. Floaters are mainly used for retained covered bonds as well as in, for instance, the UK market where GBP deals largely have a floating coupon. Meanwhile, the euro remains the dominant currency (share of 64% in the total), while the market of EUR-denominated covered bonds grew by EUR 66bn in 2019. The amount of outstanding covered bonds denominated in the domestic currency also increased substantially (by EUR56bn), taking its share to 31% of total outstanding covered bonds.
NEW ISSUANCE ALSO KEPT POSITIVE MOMENTUM IN 2019
New issuance of covered bonds kept its positive momentum, rising by the third year in a row. New issuance reached EUR 546.4bn in 2019, which was again above the EUR 500bn mark of covered bonds that were issued in 2018. Overall, issuance grew by 9% last year, versus 12% in 2018. Issuance of all types of covered bonds increased in 2019, although mortgage backed covered bonds remained by far the dominant type. Issuance of mortgage backed covered bonds rose by EUR 36bn, while their share in total new supply was 93%. Public sector covered bond issuance increased by EUR 8bn (share of 6% in total), while issuance of ship covered bonds even grew by EUR 2bn, taking their share to 1%.
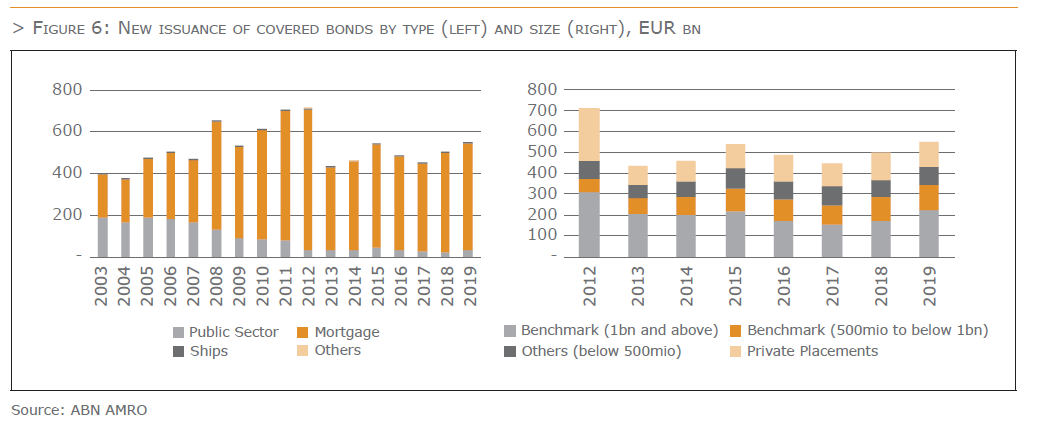
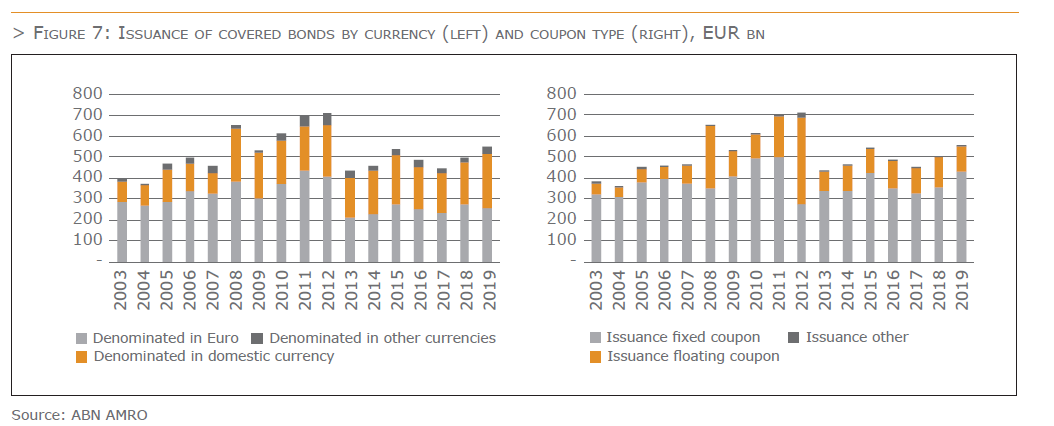
A breakdown by other categories showed that , private placement market saw less issuance in 2019 compared to 2018, with public placements rising strongly. Interesting to note is that covered bonds with benchmark size of EUR 1bn of more posted a very strong increase of EUR 53bn. This was mainly due to Denmark, where issuance picked up the most (see below), strengthening its position as largest covered bond market. Most Danish covered bonds fall in the EUR 1bn and above category. Meanwhile, Danish covered bond issuance was mainly in its domestic currency, lifting this category as well. In fact, issuance of euro-denominated covered bonds declined by 6% in 2019, with the share of domestic and euro currency issuance roughly equal. The EUR 15bn drop in EUR issuance was largely due to less issuance from Italy. Finally, issuance of fixed coupon covered bonds increased by EUR 73bn last year, whereas that of floating coupons and other coupon types declined.
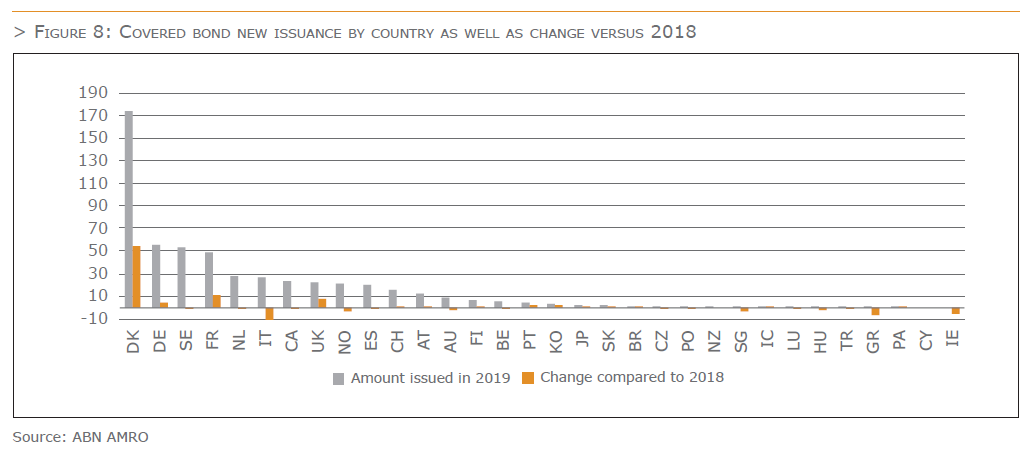
As said, Denmark was again the country leading the new issue table. Its issuance volume also posted the strongest grow (+EUR 54bn). Germany took the second place with EUR 55bn of issuance (+5bn versus 2018), while Sweden moved from second to the third place (EUR 53bn), closely followed by France (EUR 49bn), which saw annual issuance volumes rise by EUR 11bn (second after Denmark). At the other side of the side of the spectrum, we find Italy, of which new supply dropped by EUR 18bn compared to 2018. The country dropped to the sixth place, still having issued EUR 27bn.
DEVELOPMENTS BY MATURITY STRUCTURE
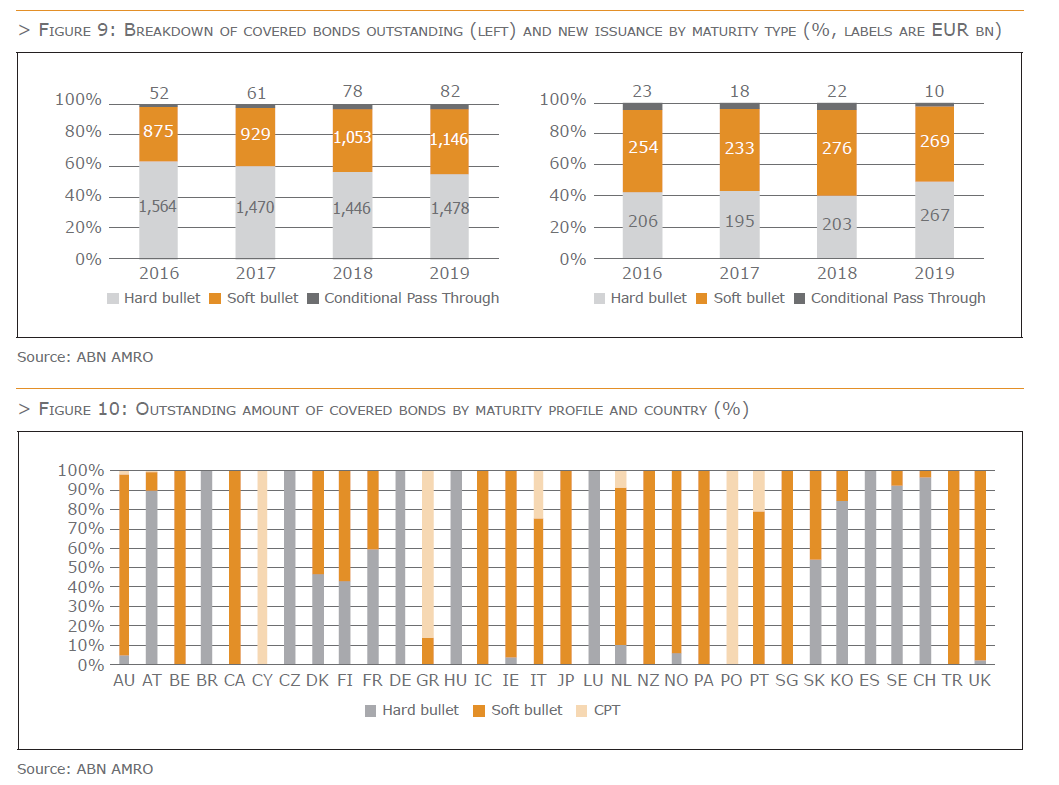
Maturity structures have been high on the covered bond agenda for years, which was also the reason to add the maturity breakdown the statistics in 2016. The discussion on maturity structures, and the extension triggers more specifically, is a hot topic surrounding the implementation of the new EU covered bond legislation in national laws. Furthermore, the ECB has excluded conditional pass-through covered bonds from its purchase programmes.
A breakdown of the outstanding amounts at the end of 2019 show that hard bullet covered bonds lost some further market share to soft bullet structures. Hard bullet covered bonds made up 55% of the total amount of outstanding covered bonds at the end of 2019, while this was 63% in 2016 when this data was collected for the first time. The share of soft bullet covered bonds has risen from 35% in 2016 to 42% in 2019, reflecting that the soft bullet structure are becoming the more dominant structure. The share of conditional pass-through covered bonds was 3% last year, equal to its share in 2018.
The new issuance data show actually a strong rise in issuance of hard bullet covered bonds in 2019, but the EUR 65bn increase was, once again, mainly related to the large pickup in Danish covered bond supply. Indeed, Danish issuance of hard bullet covered bonds jumped by EUR 62bn, while that of soft bullet covered bonds dropped by EUR 8bn. Overall issuance of soft bullet covered bonds (was also negatively impacted by slowing issuance from Italy and Ireland. Still, soft bullet covered bonds had a 49% share of total new issuance, equal to that of hard bullet covered bonds. The share of conditional pass-through covered bonds was 2% last year (2018: 4%), reflecting that it remains a niche product.
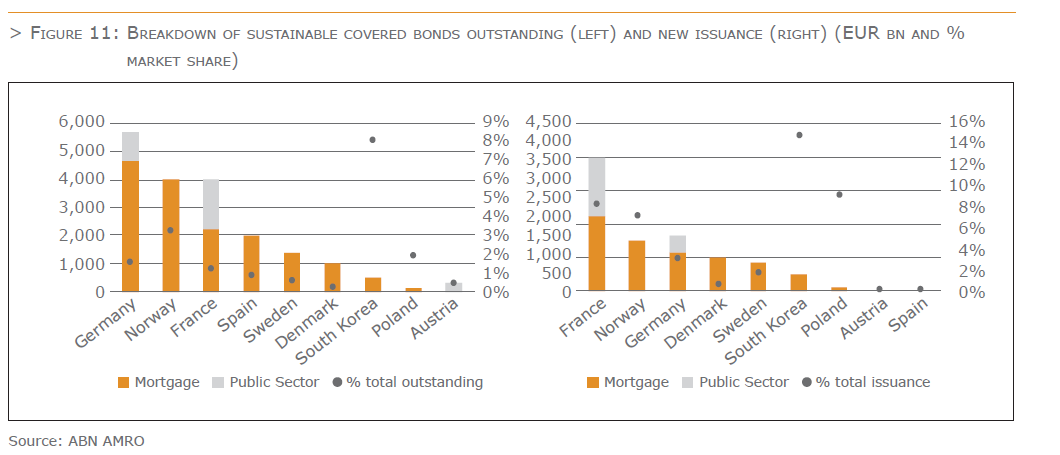
SUSTAINABLE COVERED BOND GROWING BUT STILL A NICHE
The market for sustainable covered bonds, i.e. covered bonds that have a green or social angle, has been steadily growing since the first sustainable covered bond was issued in 2015. As a result of their rising importance, we have decided to start collecting data about sustainable covered bonds this year. As said, the data will not yet be added to the statistical annex, given that the market is still in its infancies, with the total amount outstanding being less than 1% of the total covered bond market. Germany, Norway and France are the countries with the largest outstanding amounts of sustainable covered bonds, while they also issued most of these in 2019. Furthermore, the data show that 84% of outstanding sustainable covered bonds are backed by mortgages, while 16% is backed by public sector loans. Looking forward, we expect that the share of green covered bonds is likely to rise further, as sustainability is likely to become an increasingly dominant factor in financial markets.
DEVELOPMENTS IN 2020
This year, new issuance of covered bonds have slowed down compared to previous years, following the outbreak of the Covid-19 pandemic as well as central bank policy measures taken to stem the damage from the crisis. New issuance of euro benchmark covered bonds started 2020 at a solid footing, although issuance volumes were already lower in the first quarter than in 2019. The outbreak of the pandemic lowered issuance volumes even more. Having said that, covered bonds also proved their crisis-proof nature, providing funding to banks during the crisis, as this was hardly possible for riskier ranks of bank debt. Meanwhile, the GBP as well as the USD covered bond markets also made healthy starts to the year.
Issuance of euro benchmarks has dropped by almost 30% so far this year, which is largely due to central banks that have offered very attractive funding for banks in their response to the crisis. The ECB made, for instance, the terms of the TLTRO-3 even more attractive, resulting a very large take-up in the June operation. This was already signalled by the fact that retained issuance of covered bonds rose strongly during this year (which will be interesting to watch in the 2020 statistics exercise). Overall, the TLTRO-3 operation has clearly reduced 2020 covered bond supply, while large deposit inflows also have lowered bank funding needs. New issuance has picked up somewhat after a very quiet summer period, but it is unlikely to reach volumes seen in the past two years.
On a positive note, we have seen more issuance of sustainable euro benchmark covered bonds year-to-date than during 2019 as whole. The year has also welcomed the first covered bond of which the proceeds will be used to finance public loans related to Covid-19. As such, this market is set to grow further.

ECBC Statistics 2019 video – Joost Beaumont, Chairman ECBC Statistics & Data Working Group/ABN AMRO


The European Covered Bond Council (ECBC) is the platform that brings together covered bond market participants including covered bond issuers, analysts, investment bankers, rating agencies and a wide range of interested stakeholders.


