30 March 2020


By Joost Beaumont, ABN AMRO, Therese Mårtensson, Association of Swedish Covered Bond Issuers (ASCB), Lars Ravn Knudsen, Finance Denmark, Steffen Dahmer, JP Morgan, Moderator of the ECBC Liquidity Task Force & Chairman of the ECBC Market Related Issues Working Group and Michael Weigerding, Commerzbank
The international covered bond benchmark segment, which started as an interbanking market-making (head to head) market in the 90s, transformed during the crisis into a pure client (investor) market-making market.
A functional repo market constantly increases the liquidity of the Covered Bond market, as a consequence of which the Covered Bond benchmark market is one of the most significant and liquid market segments. Covered
bonds are viewed in different ways: thanks to their nature and rating some view them as part of the rates world, others clearly see credit elements and consider Covered Bonds as the strongest product in the credit world.
As is the case for any other market in the rates or credit world, the Covered Bond market faces regulatory requirements which result in a more prudent approach to trading books in terms of balance sheet allocation. In short, bank inventories have gone down and often only axed trading books are able and willing to show competitive prices and sizes to investors.
We continue to see the trend that EUR 500mn is becoming more and more the standard benchmark size for issuers, although issuers with larger annual funding appetites still favour a EUR 1bn deal or larger. In other markets such as GBP the majority of benchmark deals is between GBP 500-750mn, in USD’s the “regS only” market often targets 600mn (to match the regulatory important 500mn + EUR equivalent) while 144a or SEC registered deals are often larger than/or at least USD 1bn. The Swedish or Danish Kroner Covered benchmarks can grow over time to a significant size often larger than in Euro or Dollar benchmarks. Obviously smaller benchmark volumes often lead to smaller secondary turnovers given that the various Covered Bond markets are dominated by a majority of buy and hold investors. Furthermore, redemptions were rather high between 2013 and 2017, resulting in negative net supply. This trend turned in 2018 and it seems that net supply will also be positive in 2019. Still, the covered bond market shrank between 2013 and 2017, with the volume of outstanding bonds shrinking by around EUR 120bn, a situation which has not been corrected by the purchase of covered bonds by the Eurosystem. Overall, new jurisdictions such as Singapore, Poland, Korea, Japan and others helped to address the net issuance reduction during this period. It was in 2018 that gross issuance of euro benchmark covered bonds was almost EUR 50bn more than redemption. At the time of writing, net supply was more than EUR 30bn positive in 2019. The recent positive net supply has partly compensated for the shrinkage of the market in 2013-2017.
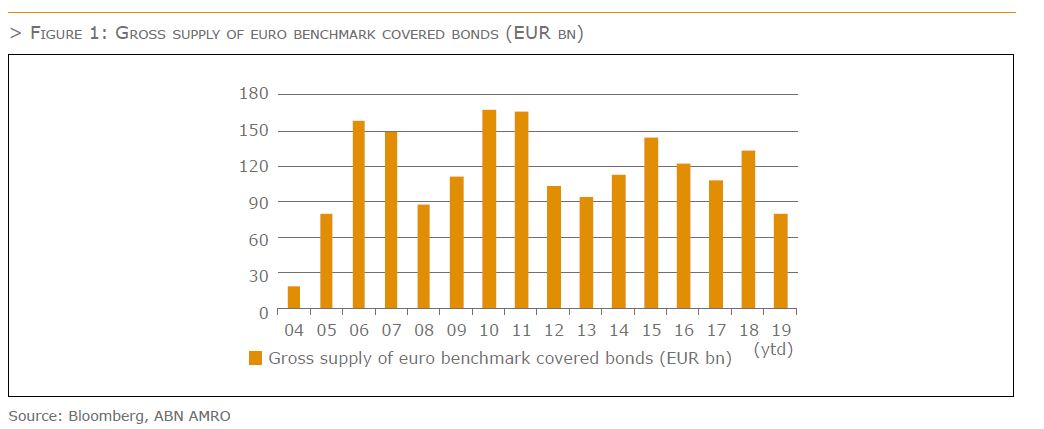
In summary, lower net supply, new deal size developments, a change of regulatory requirements and the nature of the investor base have a direct impact on secondary liquidity. Gross supply of euro benchmark covered bonds clearly increased up to 2015, after it slowed down in 2016 and 2017, before rising strongly again in 2018, although it has slowed down somewhat in the past two years. Further to a decline in 2012 and 2013, gross issuance started to pick up again in 2014, supported by an increase in both the number of new issuers as well as a rise in the amounts issued from jurisdictions outside the euro area. In 2015, the rise in gross supply of euro benchmark covered bonds was due to increased issuance from banks located within the euro area. This was related (at least partly) to the Eurosystem’s CBPP3, which has made it increasingly attractive for banks to issue covered bonds. However, the rise in gross supply from euro area issuers was fully offset by primary allocation to the Euro area central banks under CBPP3. Therefore, on a net basis, there was no increase in
supply as available volumes to traditional investors decreased. In 2016, gross supply dropped again, mainly driven by a decline in issuance from banks located within the euro area. This, in turn, was largely due to the TLTRO2, which allowed these banks to borrow very cheaply (possibly at negative rates) at the central bank and non-covered issuance driven by regulatory changes to bolster banks capital structure. As a result, some covered bond funding appears to have been replaced with TLTRO2 borrowings. Therefore, ultimately, the actions of the Eurosystem (CBPP3, TLTRO2) dampened turnover and reduced liquidity in 2015 and in 2016, with
the size of the traded volumes dropping remarkably.
In 2017, gross issuance slowed down further, however this was mainly related to less issuance from banks outside the euro area, and from Canadian banks in particular. This was largely driven by euro area banks which have been issuing relatively large amounts . This is most likely because they preferred to make use of the still good conditions in the primary market, still benefitting from CBPP3, in anticipation of the Eurosystem reducing CBPP3 purchases and bringing net purchases to zero by the end of the year. However, non-EU banks also increased their presence in the primary market, Canadian banks in particular. Finally, the market welcomed the first new euro deals from Japan and Korea in 2018, helping to lift supply. So far in 2019, issuance has also been very strong, exceeding 2018 levels so far. Issuance has likely been supported by favourable market conditions, with dark clouds on the horizon. Therefore, it seems that issuers have brought forward issuance.
Although many traditional covered bond investors have also become mainly long term investors for various reasons, a high oversubscription level and a large allocation to fund managers usually goes hand in hand with greater trading activity on the secondary market. To summarise, the CBPP3 purchases appear of course to have impacted covered bond’s trading volume. However, the allocation to fund managers has risen in 2019, which should have improved liquidity somewhat.
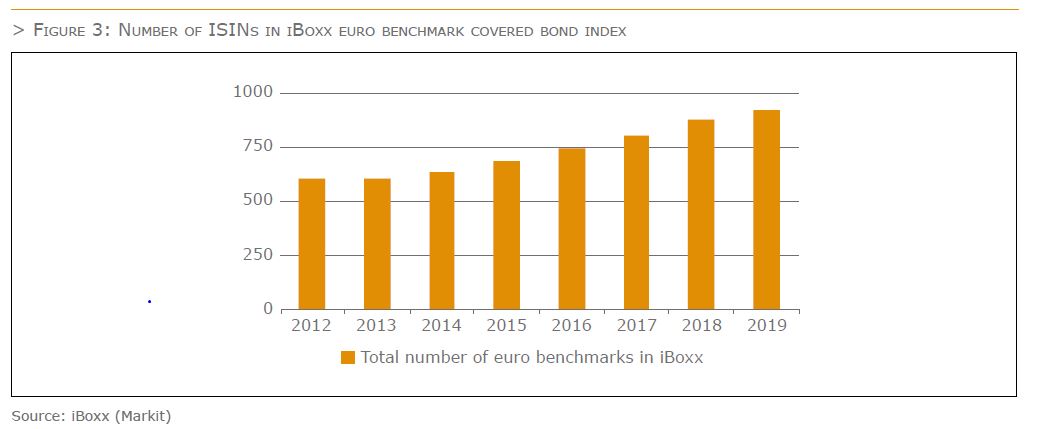
Meanwhile, the number of benchmarks outstanding in the Markit iBoxx euro covered bond index has steadily increased in recent years. In May 2019, the iBoxx included 925 benchmarks, which was up from 837 a year ago and which is around a third more than at the end of 2013. However, the sum of the nominal value of the benchmarks has risen by a smaller number, reflecting the decline in average deal size. Still, the number of flavours that investors can choose from has increased steadily over recent years, which in the end should be beneficial for liquidity.
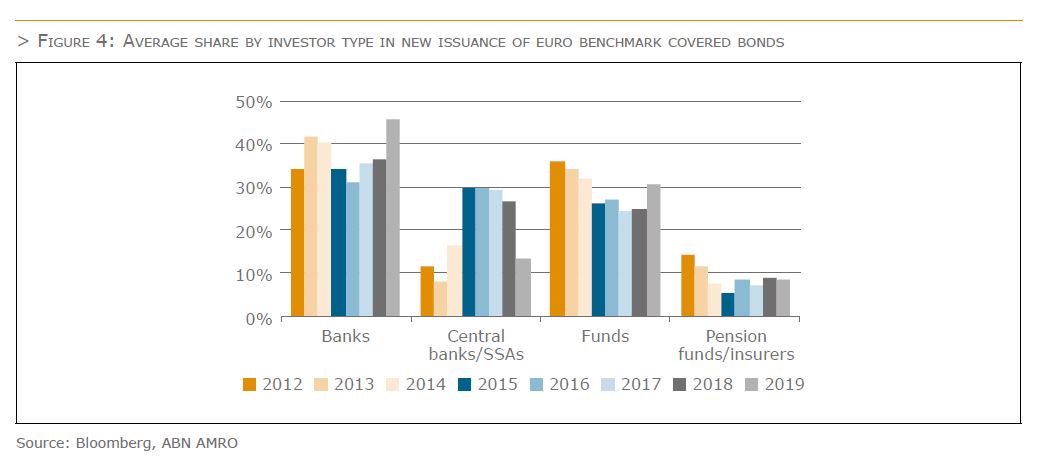
Let us again look at the evolution of the investor base as an angle for liquidity. If the share of buy-and-hold investors has risen in the past few years, this should have reduced liquidity of covered bonds. The graph below shows the average share per investor type in new euro benchmark deals. The graph clearly illustrates the crowding out impact of CBPP3. The share of central banks/SSAs has risen sharply, actually quadrupling from around 8% in 2013 to around 30% during 2014-2018. This has come at the expense of other investors, such as banks, asset managers and institutional investors. However, asset managers have seen the biggest drop in their share. As these can be regarded as the most active portfolio managers, it seems fair to conclude that the change in the investor base in recent years has not supported liquidity of covered bonds.
But also, in this case, it seems that there are some positive developments. In 2019, the share of central banks has declined sharply, as the Eurosystem has stopped net purchases of covered bonds, while also having shifted the focus of reinvestment towards the secondary market. The gap has been filled by banks, but also by fund managers, which saw their allocation in new deals rising to 31% so far in 2019 (up from 25% in 2018). In the end, this should improve liquidity.
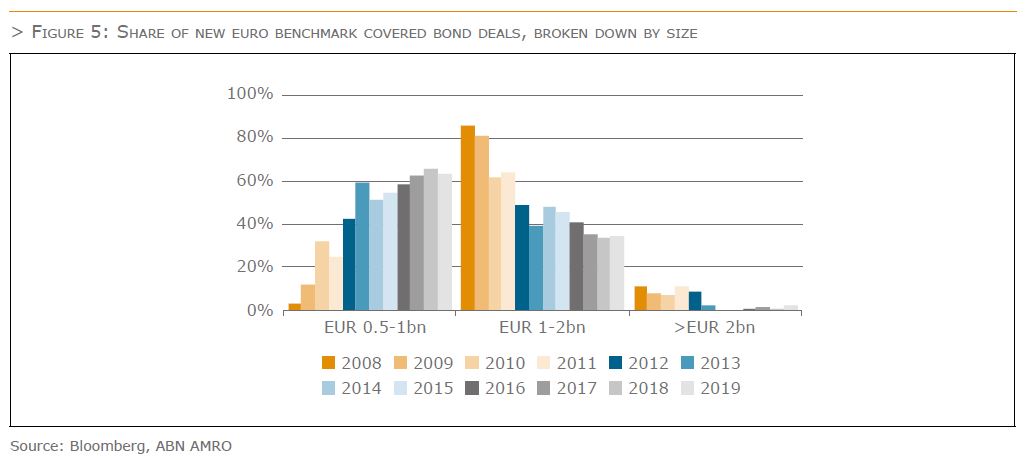
Finally, the larger the issue size, the better the liquidity. But also, in this case, it seems that recent developments point in the direction of reduced liquidity. The graph below depicts the share of new deals broken down by issue size. The share of deals with an issue size below EUR 1bn increased strongly in recent years. Whilst only 3% of the deals had a size smaller than EUR 1bn in 2008, more than 60% of deals had such a size last year. In contrast, only 2% of new issues had a size above EUR 2bn in 2019 so far. Meanwhile, the share of deals sized between EUR 1bn and EUR 2bn started to drop sharply in 2010, remaining roughly stable at around 35%, which is less than half of the share of such deals in 2009. So, from an issue-size perspective, it seems that liquidity has deteriorated rather than improved in recent years, only having improved very slightly in 2019 so far.
How much, how often and where? Secondary market trading in the covered bond market
Each time the covered bond segment came under general spread pressure in recent years, its (lack of) market liquidity came into the spotlight again. In view of the defensive stance taken by many market makers, it has
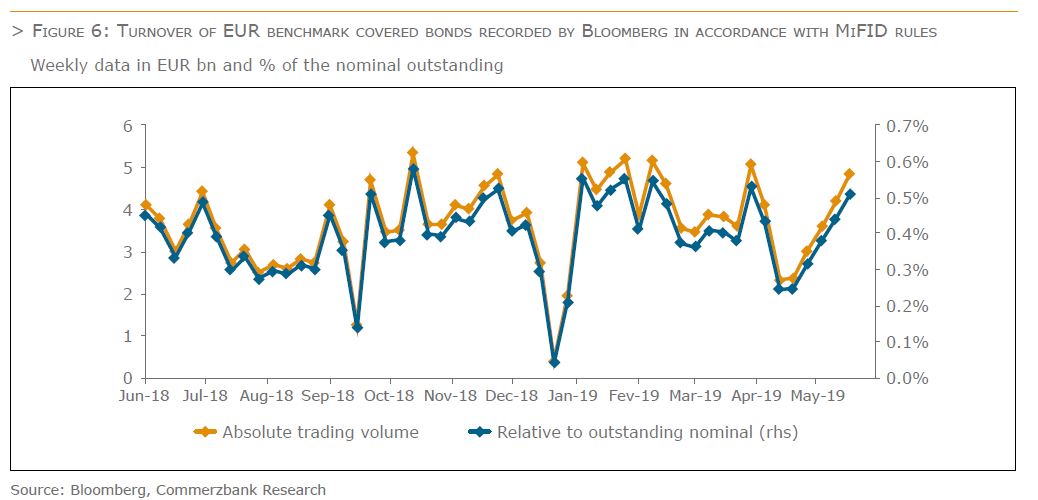
become all the more difficult for investors to sell larger positions in some segments, if required. In contrast, some market participants report slightly better liquidity since the start of the year. Therefore, it should be useful to take a look at the numbers: How has liquidity in the covered bond market developed over recent months? In order to gain a broader overview, we analyse the trading volumes that are aggregated by Bloomberg as part of MiFID reporting. After adjusting the data,[1] we can identify a total trading volume of around EUR 168bn for EUR benchmarks via Bloomberg for the period from June 2018 to April 2019. On a weekly average, this is just under EUR 4bn or 0.4% of the outstanding volume – with slightly higher turnover in Q1.
However, as is well known, it is by no means unusual when even younger covered bonds fail to trade at all in individual weeks. Calculated across all benchmarks, we see this happening on average every third week. This highlights the fact that liquidity in the covered bond market, while having stabilised, clearly remains at a low level. A glance at the ticket sizes confirms this assessment. Naturally, the number of transactions processed on stock exchanges significantly exceeds that of other sources. However, their volumes are usually negligible. If one excludes stock exchanges, there are just under 84,000 transactions left between June 2018 and April 2019. Their average ticket size was only around EUR 2mn. This figure corresponds to the ballpark figure suggested by Trax data in the past and should therefore reflect the current state of the market quite well.
Which factors influence trading volume?
Whether the liquidity of a covered bond is high or low is not easy to determine. For one thing, market liquidity is difficult to measure. We therefore focus on trading volume here. Furthermore, there are naturally a number of different factors that influence the liquidity or trading volume of bonds – and these must be taken into account when comparing individual covered bonds. In addition to the age of a bond, its size and market risk, these include seasonal factors, the quality of its allocation, demand during book building and primary market supply. We have recently verified these liquidity drivers in three detailed studies.[2] Our dataset for the turnover recorded by Bloomberg between June 2018 and April 2019 confirms the findings there.
The average trading volume of a covered bond, for example, increases with its size. However, trading volume grows at a slower pace: the turnover of a EUR 1bn – EUR 1.24bn bond was roughly 80% higher in the mentioned period than that of a EUR 500mn – EUR 749mn issue. There is therefore no jumbo bonus with regard to liquidity. Moreover, our data confirms that weaker-rated securities are traded more frequently: The turnover of triple-B rated covered bonds was more than twice as high as in the double-A category.
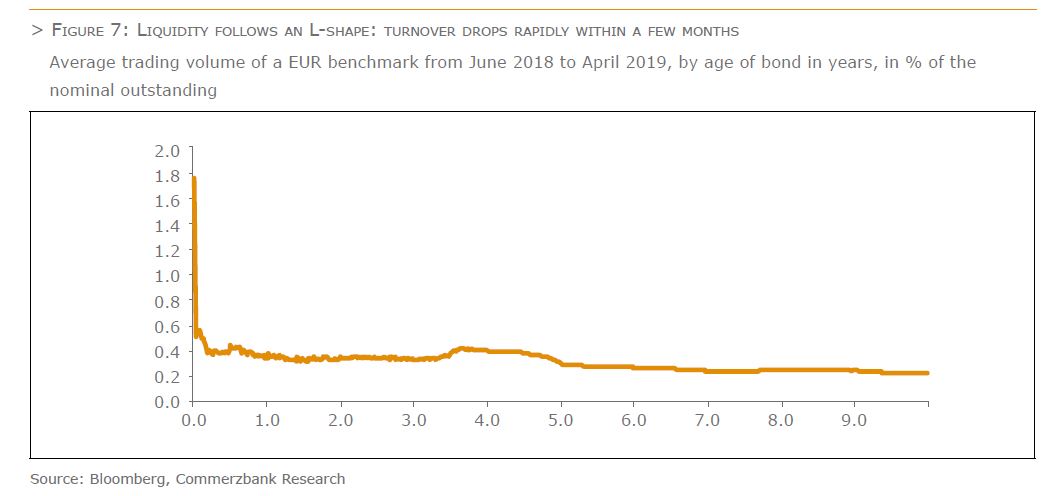
However, by far the most important factor for the trading volume of a covered bond is its age. While switch trades, profit taking or follow-on purchases support the turnover, over time, volume increasingly seeps away due to buy-and-hold investors. Our data shows that, on average, the weekly turnover falls below 0.5% of the outstanding volume after only two months. After one year this rate is only 0.35%, and in the long run it typically levels off between 0.2% and 0.3%. On the market as a whole, the turnover is likely to be higher, but the trend should be the same.
To best compare covered bond turnover between individual bonds despite the high number of influencing factors, we convert the trading volumes to their shares of the nominal. In the following analysis, we also differentiate according to the issue date of the covered bond.
Which products had the highest trading activity?
Due to the dominant age effect, middle-aged covered bonds are most interesting for statements on fundamental liquidity trends, in our opinion. They represent the bulk of the outstanding volume, and while they reflect the medium-term turnover potential, they are not yet excessively dominated by buy-and-hold investors. They are therefore likely to be the focus of most investors. Consequently, we exclude bonds that were issued after December 2017 from our analysis.
If the trading volume of covered bonds issued between 2015 and 2017 is broken down by country of origin, we note a marked “headline effect”: i.e. bonds that are (potentially) in the focus of the news tend to be traded more often. The rating effect described above fits well with this: bonds with lower ratings are generally traded more often because they can be used, for example, to convert market movements into returns more easily. Greek and Turkish covered bonds have therefore frequently appeared at the top of our previous trading volume overviews. The new data are in line with this. The trading activity of UK covered bonds is also likely to have been supported by the steady Brexit news flow. With a turnover of 25% of the outstanding volume, UK securities
reached more than double the level of French or German covered bonds from June 2018 to April 2019.
This, however, should not lead to the reverse conclusion that overseas markets such as Australia, New Zealand or Canada, which are also among the top traded segments, may be regarded by investors as risk products. In contrast to the UK, these covered bond segments have repeatedly attracted attention with high trading volumes in our turnover analyses of recent years, without these countries continually ‘hitting the headlines’. The relatively high trading activity in overseas products is therefore more likely to testify to solid intrinsic liquidity. This may be partly due to the absence of CBPP3 purchases in these countries, which are largely held to maturity.
This snapshot should also not be overestimated with regard to Austrian covered bonds, whose turnover was only 8% of the nominal value. Since Austria was one of the best performers in the market in the second half of 2018, investors probably saw little need for trading in their portfolios. This may well change though again. In addition, the activity of older Austrian paper issued before 2015 is noticeably higher. When measuring turnover in German Pfandbriefe, there could be some distortions since, due to data problems, we exclude transactions reported via Deutsche Börse. German market makers could therefore be slightly underrepresented in our database and the turnover of German Pfandbriefe somewhat underestimated. However, the relevance of this should not be overstated. Particularly since the lively primary market since September 2018 probably supported German secondary market turnover at the same time. Rather, the relatively low trading volume in German Pfandbriefe is more likely to be attributable to their lower yields, which make them less attractive to many active trading investors.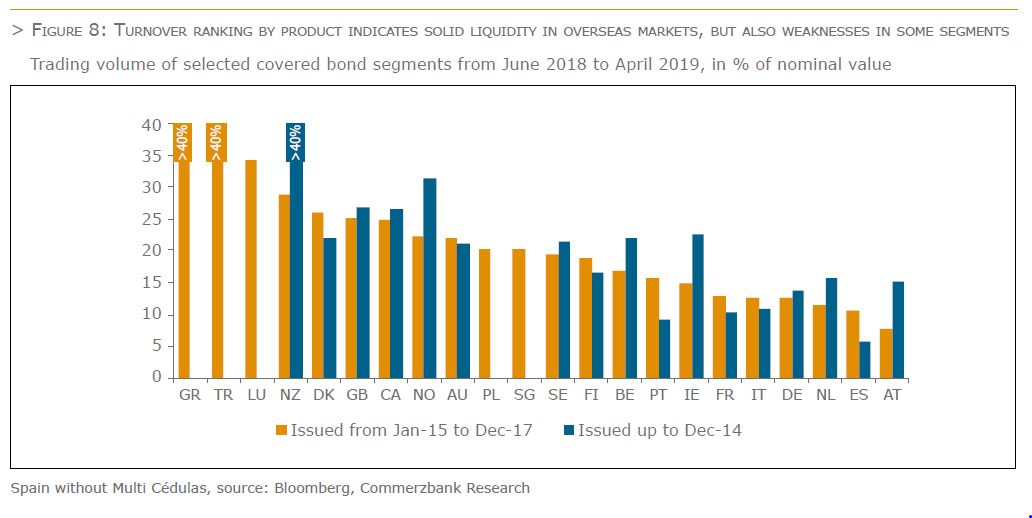
It may come as a surprise to learn that Spain and Italy are so far behind in our ranking. Due to the weaker ratings and the various political headlines from the periphery, covered bonds in Spain and Italy could theoretically have been expected to be much more active. In part, the deviation is probably due to the low primary market activity in Spanish and Italian benchmarks. This is also depressing secondary market activity. In our opinion, however, the data also show the general liquidity weakness and one-sidedness of the market. Many investors will have experienced this last year when they tried to sell Italian covered bonds at reasonable conditions. If we also include covered bonds issued before 2015, there is little change in our turnover ranking by country. Even if Multi Cédulas are considered, Spanish covered bonds do not move beyond the back midfield.
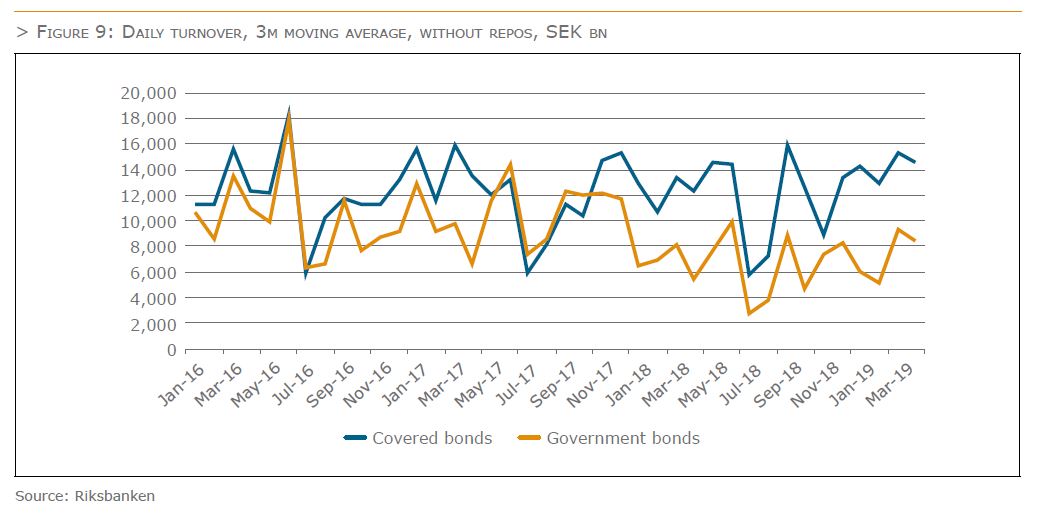
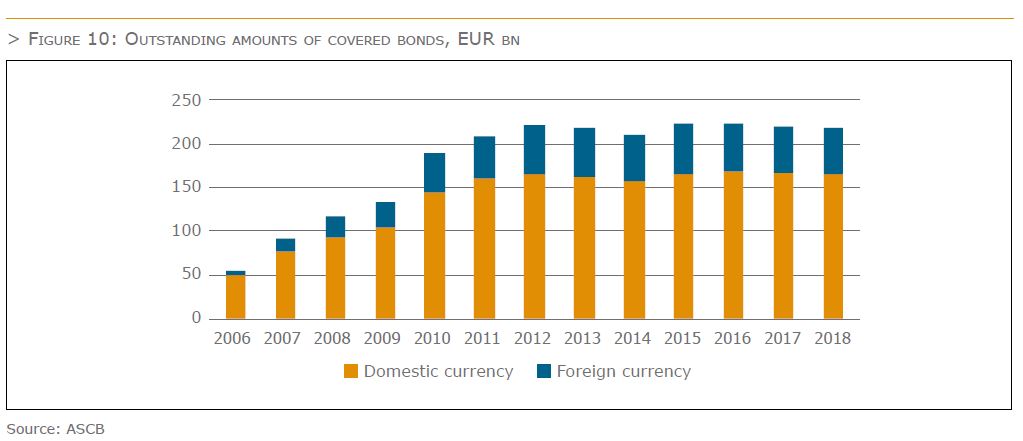
The Swedish domestic market for covered bonds is of great importance for the domestic capital market. Before Sweden implemented a law for covered bonds in 2004 a liquid market for mortgage bonds had been around since the beginning of the 80s. The outstanding volume of covered bonds in SEK was EUR 164.3 bn at year end 2018. That was more than twice as much as the outstanding volume of government bonds.
Swedish bond market investors appreciate liquidity. The large banks issue their covered bonds as benchmarks which mean that large amounts are issued and that a number of dealers are contracted to show both bid and offer prices. Also, only benchmarks are deliverable in the future contracts. When a new benchmark-bond is issued, the issuers make sure that the amount issued meets the requirements for a benchmark sized deal. After the initial day of issuance, the issuer can, without further notice, issue “on tap”. The benchmark bonds can amount to volumes of about SEK 60 bn. Sweden has a liquid and smoothly operating repo market with almost all banks and broker firms involved in the trading. The issuers offer their market makers a repo-facility in their own bonds. The repo transaction is viewed as a ‘sell-buy back’ or ‘buy-sell back’ deal and the ownership of the security has to be transferred.
Overall, this system has been working for a long period of time. The recently implemented legislations regarding higher capital requirements, greater information requirements (MiFID II) and other potential obstacles such as the leverage ratio, structural reforms etc. have not been observed to have had any significant effects on the liquidity in the Swedish covered bond market. The Swedish Central Bank (Riksbanken) has been aggressive in its Quantitative Easing (QE) policies, which means that the central bank now owns a large part of outstanding government bonds. The Riksbank does not have any intention to buy covered bonds in its QE operations, but activities in the market could still suffer from the policies. So far, the QE operations have however not resulted in any significant decrease in turnover. Studies of the liquidity in the Swedish covered bond market, performed by the Swedish FSA, show that the liquidity is still good.
The type of bonds making up the Danish covered bond market fall into three major segments: callable bonds, bullet bonds and floater with or without a cap. All bonds are UCITS compliant and the vast majority is CRR compliant. The market comprises a great number of securities, but the vast majority of the nominal value is concentrated on a relatively small number of large series. With an outstanding volume of EUR 406bn the Danish covered bond market is the largest in Europe. Trades in mortgage covered bonds are reported to the Danish stock exchange, Nasdaq Copenhagen, including over the counter trades and excluding repos.
Average monthly turnover on Nasdaq Copenhagen including over the counter trades and excluding repos in the period 2011 – 2018 came in at close to DKK 549bn (app. EUR 73.5bn). In 2018 average monthly turnover was DKK 650bn (app. EUR 87bn), cf. Figure 16, or approximately 21 percent of the outstanding volume. This is more than previous years, however by the beginning of 2018 a new transaction reporting was implemented meaning that more transactions with borrowers are included in the data.
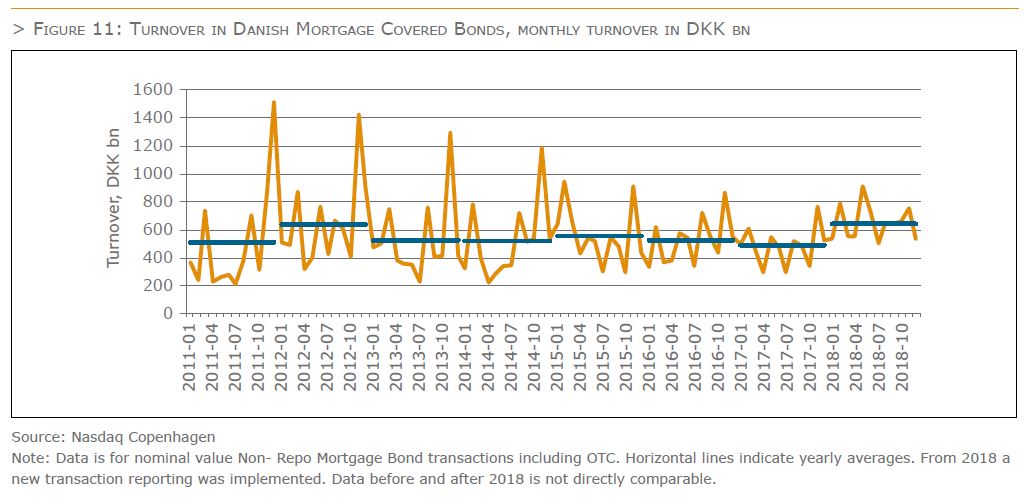
Repayment activity in fixed rate callable has in 2018 remained relatively high. Partly due to the high repayment activity, issuance of callable bonds in the primary market was once again a driver for turnover in 2018. Meanwhile, as covered bonds issued outside the Euro area are not eligible for purchase under CBPP3, the Danish covered bond market has not been directly affected by quantitative measures by the ECB, which have been a major factor dampening transaction activity in the Euro area. However, an indirect effect cannot be ruled out. In 2018 the share of foreign investors owning Danish covered bonds has stabilised around 22.5% which is on level with the share from end 2017. During 2018 the foreign investors have decreased their owner share of issuances with shorter maturity while increasing their holdings of bonds with longer maturities. Currently, foreign investors are having a positive effect on market turnover and liquidity, but longer-term effects remain to be seen.
Previously, the data was characterised by high turnover around the time of the November/December refinancing auctions of bullet bonds financing adjustable rate mortgages. Over the years, the spike has somewhat diminished as mortgage banks have spread the refinancing auctions from one to four annual settling periods, although this does not affect average transaction volume over the year.
Pass through, tap issuance, quarterly refinancing auctions and frequent early repayment activity are all characteristics of the Danish covered bond market, which among other more universal factors affect the level of market turnover. The strict balance principle deployed by Danish mortgage banks incorporates pass through and means that mortgage covered bonds are tap issued on the go, in sync with demand for mortgage loans. Following the initial tap issuance, mainly bullet bonds and to an extent floaters, are refinanced by the issuance of new bonds at refinancing auctions over the life of the loan.
Another specific influencing liquidity in the Danish covered bond market is borrowers’ early repayments. Any Danish covered bond can be bought back by the borrower at the current market price and delivered to the issuing mortgage bank – the buy back option – or in the case of fixed rate mortgages be redeemed at par. This type of early redemption activity gives rise to an increase in transactions both when bonds are bought back (the buy-back option), and when new bonds are issued. Again in 2018 market developments encouraged early repayment activity.
Meanwhile, while not all implemented, liquidity rules including the LCR and NSFR, leverage ratio and capital requirements for market risk FRTB are already unintentionally increasing the cost of market making and repo transactions through increased capital requirements and stricter liquidity management rules. Due to tap issuance, the market maker function of universal banks is handed a central role providing liquidity in the covered bond market, as professional investors are mostly unwilling to buy in small batches. Onwards, market makers remain the main source of liquidity in the Danish covered bond market. However, higher capital charges, liquidity rules and the low interest rate climate have put pressure on the profitability of market making.
In 2015, the Central Bank of Denmark, Danmarks Nationalbank, found evidence that the five largest universal banks in Denmark have reduced their net positions available for market making by DKK 100bn since mid-20143. To a lesser extent, market makers will be providers of market liquidity, rather than makers between buyers and sellers in the market. In 2016 Finance Denmark conducted a qualitative interview-based study among investors to explore how they perceive the evolution of the market making function. The results show that, compared to ten years ago, the execution of trades above DKK 500 million takes longer and moves prices more. While market makers have reduced holdings, on the receiving end have been, among others, institutional investors, which could also lead to lower turnover going forward.
Although approximately 83% of the outstanding volume of mortgage covered bonds are in series sizes above EUR 500 million, giving rise to an LCR classification of Level 1B for the AAA rated Danish covered bonds, the new liquidity rules create a challenge in managing smaller series sizes. If investors are unsure if a bond series will reach the critical mass – as bonds are tap issued – to qualify as Level 1B- or Level 2A-assets under the LCR, the pricing of the specific series may be negatively affected. This is an issue also affecting market makers.
Repo activity has declined from 2012 to 2017. In 2018 repo turnover was at the same level as in 2017. The decline in the covered bond repo market is a consequence of the stricter capital and liquidity requirements mentioned above, while the lower yield spreads between covered bond and repo rates are also squeezing hedge funds out of the repo market.


The European Covered Bond Council (ECBC) is the platform that brings together covered bond market participants including covered bond issuers, analysts, investment bankers, rating agencies and a wide range of interested stakeholders.


