13 December 2017

By Kai Ebeling and Matthias Melms, NordLB
This article is taken from the 2017 edition of the ECBC European Covered Bond Fact Book, which can be accessed here.
As part of LCR regulation, banks must be able to cover the cash outflow for the next 30 days through liquid assets. Depending on the jurisdiction, various assets can be held for this purpose, with assorted weightings of assets used and with different haircuts applied to the individual assets. In contrast to the original proposal by the Bank for International Settlements (BIS), which intended an allocation of covered bonds as Level 2a assets, covered bonds were classified as Level 1 assets within the European Union (EU), following a lengthy process.
Since October 2015, there has been an obligation on bank treasuries in the EU to meet the liquidity coverage ratio at a binding level. While high-quality liquid assets (HQLA) initially had to correspond to at least 60% of the net liquidity outflows over the next 30 days in a stress scenario, the ratio has been increasing by 10% at the respective start of each year and will reach 100% on 1 January 2018. The liquidity buffer is divided into assets in the following categories: Level 1, Level 2a and Level 2b. The levels not only determine the maximum eligibility of securities (Level 1 to an unlimited extent, but at least 60% of the overall buffer; Level 2a maximum 40% and Level 2b maximum 15%), but also the haircut that applies to the market value. Under certain circumstances, covered bonds can be classified either as both Level 1 or Level 2a or 2b. As covered bonds that are classified under category Level 1 are not only subject to a higher haircut when compared with government bonds (7% instead of 0%), but also have the maximum eligibility capped at 70% (provided that the LCR portfolio is 100% Level 1 assets), we classify covered bonds as Level 1b assets in the following.
 In order to qualify for one of the level categories, covered bonds must satisfy a series of quantitative and qualitative requirements. In contrast to all other assets which can be used in the course of the LCR, criteria also apply that are not linked to the original assets. Among other requirements, issuers of covered bonds must therefore regularly report on the composition of their cover pools and provide data on covered bond issuances.The obligation to provide evidence pursuant to Art. 129 (7) of the Capital Requirements Regulation (CRR) lies with the bank that uses the covered bonds in their LCR portfolio. Further criteria that are used for the qualification under the LCR are based on the external qualification by a rating agency, although it also includes a discrimination of the rating agencies’ assessments, among other criteria. Within the EU regulation, there is also geographic discrimination of the covered bonds allocated to the individual level categories. At present, at least, covered bonds from issuers outside the EU and the European Economic Area (EEA) cannot qualify for the highest classification, as Level 1b assets. While there is discussion between stakeholders on changing these regulations, it is not at this time possible to predict whether and when a change will be made to the currently applicable rules.
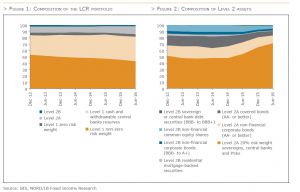
The Basel Committee on Banking Supervision (BCBS) collects data on a half-yearly basis – at the end of June and the end of December – in order to evaluate the effectiveness of Basel III. The results are generally published by the BIS in a Basel III Monitoring Report in March (June data) and September (December data). The collected data is based on voluntary submissions by the respective banks and their national supervisory authorities. The proportion of Level 1 assets in the LCR portfolios of banks examined by the BCBS has remained relatively constant at just under 90% since December 2012. In June 2016, a slight decline to 86% was recorded, as against 87% in December 2015. Accordingly, the share of Level 2a assets increased by one percentage point to 12.5%. The assets that have been categorised as Level 2b are marginal, currently accounting for the smallest share of 1.4%. Within the Level 1 tranche, the greatest share is attributable to the zero risk weight assets, but this has consistently declined since the start of the data series and fallen from 53.5% in December 2012 to just under 44% by June 2016. At the same time, the cash and central bank reserves increased by 31% to 38%. The non-zero risk weight assets have remained steady at around 4% since December 2012, which depicts the shares of the different asset categories within the Level 2 assets, reveals the role played by covered bonds. Counter to the classification of covered bonds as Level 1 in the course of the delegated regulation of LCR in the EU, covered bonds are listed as category Level 2 in the reporting of the BCBS, as originally proposed by this same committee. While covered bonds still accounted for 18% of all Level 2 assets in June 2014, this decreased in the subsequent months to less than 7% in June 2016. Within the Level 2 assets, the greatest grouping is assets that are categorised as “Level 2a 20% risk weight sovereigns, central banks and PSEs” (PSEs = public sector entities). From a proportion of 48% in December 2014, the share has increased to more than 70% at the moment. All other categories reported a fall in their percentage shares over the same period. “Level 2a non-financial corporate bonds (AA- or better)” have declined from 18% to just under 12%. “Level 2b residential mortgage-backed securities” only made up 0.6% in June 2016 (June 2014: 1.75%), while “Level 2b non-financial corporate bonds (BBB- to A+)” and “Level 2b non-financial common equity shares” respectively accounted for 3% (June 2014: 4.4%) and almost 5% (June 2014: 10.5%). In June 2015, the category “Level 2b sovereign or central bank debt securities (BBB- to BBB+)” was a new addition, with a share of 0.7%.
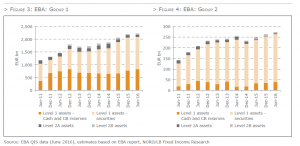
The European Banking Authority (EBA) also publishes a report that relates to the same data as the BCBS report, but comprises only banks from the 27 EU countries plus Norway. The data sample of the report is divided into two groups: Group 1 includes banks with Tier 1 capital of more than EUR 3bn, while all other banks are included in Group 2. In the LCR section, the EBA report includes a total of 132 banks, of which 34 are in Group 1 and 98 in Group 2. The charts are compiled using data from the EBA report and figures were estimated on that basis. In absolute terms, there has been consistent growth in the LCR portfolio of both groups over the past few years. In Group 1, the portfolio now (June 2016) comprises more than EUR 2.2tn (June 2011: EUR 1.2tn) and in Group 2, just under EUR 275bn is LCR-compliant (June 2011: EUR 140bn). For both groups together, the overall portfolio size therefore rose from EUR 1.3tn to EUR 2.5tn. It is notable that a strong increase could be observed in both groups 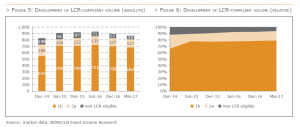 from June 2011 to December 2012 and between December 2014 and December 2015, while there was very little change in absolute portfolio size in the interim. Examining the composition of the portfolios, in Group 1, it is evident that items were above all built up in the cash and central bank reserves category at the start (from EUR 260bn in June 2011 to EUR 825bn in December 2012), while growth was subsequently recorded in the area of Level 1 securities (December 2012: EUR 785bn; December 2015: EUR 1.3tn). Level 2a assets were relatively constant, at between EUR 125bn and EUR 175bn, but dropped below EUR 90bn as at the last two reporting dates. Level 2b assets have only been included in the portfolios since December 2012 and have since accounted for around EUR 50bn. In relative terms, the share of cash and central bank reserves in the period under review fell from in excess of 50% (December 2011) to less than 40% (June 2016), while the proportion of Level 1 securities increased from approximately 39% to around 57% in the same period. Level 2 assets play a rather subordinate role, comprising less than 10% (2a) and between 2% and 4% (2b). Owing to the decline in Level 2a assets, the share in the last few reporting periods has fallen to less than 4%. In Group 2, very similar patterns can be observed, but it is notable that the share of Level 1 securities is significantly greater. It was between 75% and 85% over the reporting period as a whole. In a previous EBA report, based on data from the December data collection in 2015, covered bonds are reported separately for the class “Level 1 securities”. Accordingly, covered bonds accounted for around 6% of the LCR portfolio for all banks. There are only slight differences between Group 1 and Group 2 in this respect. While the share is slightly lower in Group 1 (around 5.4%, ~ EUR 120bn), it is a little higher in Group 2 (approximately 7.8%, ~ EUR 20bn). For the banks included in the EBA report, the overall volume of Level 1 covered bonds in December 2015 amounted to approximately EUR 140bn.
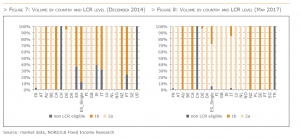
In the following, we have detailed the issue volume of EUR-denominated covered bonds with a benchmark volume on the basis of iBoxx EUR Covered as well as issuances with residual maturities of less than one year at each year-end and half-year since December 2014. It becomes clear that the overall volume has increased since the end of 2014, from an original figure of EUR 826.8bn to EUR 927.6bn as at 30 June 2016. Thereafter, it has successively declined to EUR 862.8bn in May of this year. In a second stage, we allocated the outstanding benchmarks in terms of their LCR eligibility to the categories Level 1b, 2a and “not LCR eligible”. Theoretically, some of the covered bonds classified as “not LCR eligible” should be allocated to Level 2b on account of quantitative criteria. However, given our assessment that these have not satisfied the requirements of reporting as at the reporting date by showing i) that the cover assets are assets with a maximum risk weighting of 35% (Art. 125 of the CRR) and ii) that the overcollateralisation ratio is at least 10% on a monthly basis, we have reported the respective bonds as “not LCR eligible”. In the following, we will examine the three specified categories. At the start of the time series (31 December 2014), around two in three covered bonds were classified as Level 1b, around 22% as Level 2a and the remaining 12% as “not LCR eligible”. Over the various reporting dates under review, there has been a considerable decline in the share of “not LCR eligible” covered bonds (6.3%) and Level 2a assets (14.7%) up to 31 May of this year, while that of Level 1b papers increased over the same period (79.1%). The greatest change in the period under review was observed for the reporting date of 30 June 2015 and was essentially due to rating upgrades in the euro periphery, as a result of which “not LCR eligible” bonds could be allocated to Level 2a and Level 2a covered bonds to category 1b. Furthermore, there has been a marked improvement in the reporting by individual issuers, which means that classification with regard to the LCR level is more accurate.
As mentioned above in the period under review, there was a qualitative improvement in the reporting by issuers included in the iBoxx Euro Covered. Pursuant to Art. 129 (7) of the CRR, investors are obligated to verify half yearly for their covered bond holdings in the LCR portfolio that issuers have published the following details in the course of cover pool reporting: i) the outstanding volume of covered bonds and the securities in the cover pool, ii) the geographic distribution of cover assets and the types of borrower, the loan size and interest and currency risks, iii) the maturity structure of the cover assets and covered bonds as well as iv) the percentage of loans in the pool that are more than 90 days overdue. When reviewing the cover pool reports from issuers in the iBoxx EUR Covered for fulfilment of criteria pursuant to Art. 129 (7) of the CRR, we found only few incomplete reports had been published by the end of 2015, but reporting has since steadily improved. However, it should be noted that reporting by covered bond issues is in our view of a high calibre, on the whole. This is to some extent also due to the Harmonised Transparency Template (HTT) initiative launched by the European Mortgage Federation (EMF) and the European Covered Bond Council (ECBC). Since 2015, issuers outside the EEA have been able to use the HTT and consequently be awarded the Covered Bond Label, which guarantees compliance with the requirements of Art. 129 (7) of the CRR. As at 15 May 2017, the HTT was being used by 90 issuers for a total of 106 covered bond programmes in 16 different jurisdictions. Although the obligation to provide evidence in relation to the necessary qualitative criteria for covered bonds continues to lie with investors, it is our view that HTT makes a significant contribution to enhancing the transparency and quality of reporting.
In order to ascertain the influence of the LCR on the behaviour of banks in covered bond primary market transactions, we examined all benchmark bonds (> EUR 500m, investment grade, publicly placed, minimum three joint leads) to identify the differences between the individual level categories. To this end, we allocated all bonds to which the above criteria apply at the time of issue to one of the following portfolios: Level 1 Core Eurozone (EZ), Level 1 Periphery (P), Level 1 Other Europe (OE), Level 2a Periphery and Level 2a Overseas and Others (O&O). To then establish the participation of banks in the individual transactions, we evaluated the 510 deal reports of all transactions since the start of 2014. A deal report is normally compiled by a bank involved in the transaction and made available to a limited circle of interested parties. After a description of the transaction, the deal report also includes information on the investors that participated in the transaction, such as information on the geographic distribution and the type of investor. Of the 504 deals, 261 transactions were allocated to the portfolio Level 1 Core Eurozone, 32 bonds qualified for Level 1 Periphery and 88 for Other Europe. Of the 123 transactions t hat qualified as Level 2a assets on the date of issuance in the period under review, 57 bonds were placed in Level 2a Periphery and 66 in Level 2a Overseas. Based on this data, we have ascertained the share of banks in the allocation of each individual deal. The overall issue volume in the period under consideration amounted to EUR 426bn, with EUR 144.6bn attributable to banks, corresponding to a share of 33.9%. In contrast, the average across all percentage shares of banks reported for all 504 deals was 35.3%. This allows for the initial conclusion to be drawn that banks are mostly involved in deals where the volumes are not high.
The aggregate issue volume of the Level 1 Core Eurozone portfolio was EUR 193.4bn, of which EUR 68.9bn was attributable to banks, corresponding to 35.7%. In the past, this has ranged from 45.3% in 2014 to 28.1% in 2017. Since 2014, 32 bonds qualified for the Level 1 Periphery category, with a total volume of EUR 31bn, of which bank allocation amounted to EUR 4.8bn overall. The share is therefore 15.5%. As no transactions were reported for this portfolio in 2014, it is only possible to consider bonds between 2015 and 2017, whereby the bank share remained stable, ranging from 14.8% (2015) to 16.7% (2017). The Level 1 Other Europe portfolio included 88 bonds with a total volume of EUR 79.8bn, with total allocation to banks at EUR 36.8bn (45.6%). The allocation ranged between 44.7% (2014) and 51.2% (2017). The issue volume in the Level 2a Periphery portfolio was EUR 50.8bn in the reporting period, with EUR 7.9bn allocated to banks. The share varied from 7% (2017, one transaction) to 16.5% (2014). By contrast, an issue volume of EUR 66.8bn was recorded for the Level 2a Overseas category, with a bank volume of EUR 25.1bn and a share of 37.6%. Since 2014, this share has therefore fluctuated between 31.4% (2016) and 41.7% (2014). Although the market share of banks was relatively stable at around one third from 2014 to April 2017 (range: 31.1% to 38.8%), there are notable differences between the portfolios: while the percentage share accounted for by banks in the Level 1 Core Eurozone portfolio has been falling, the allocated volume has remained between EUR 22.8bn (2015) and EUR 16.9bn (2016). Conversely, the banks’ market share for bonds from issuers outside the eurozone, but within the EEA is significantly higher and ranges between 44.6% (2014) and 51.2% (2017), with the allocated volume also stable at around EUR 10bn. Covered bonds that qualify for the Level 1 Periphery portfolio on the date of issue are considerably rarer on the market, at just 32 transactions overall. They are therefore of less importance than all the other portfolios. The bank participation ratio is between 14.8% (2015) and 16.7% (2017), so on a stable, but low level. A similar picture emerges for the participation of banks in Level 2a Periphery transactions. With the range spanning 12.9% (2016) to 16.5% (2015), allocation to banks is again stable at a low level. Bank allocation is noticeably higher for transactions placed by issuers based outside the EEA and which therefore qualify for the portfolio Level 2a Overseas. This participation rate was between 31.3% and 41.7%, which is a significantly higher level. In our view, this shows that, in terms of bank allocation, the treatment of covered bonds that qualify as Level 1 assets does not differ from those that are Level 2a assets. Although the allocation volume is different between the portfolios (Level 1: EUR 110.6bn versus Level 2a: EUR 33bn), the allocation levels of banks are on comparable levels. A serious situation is apparent in the allocation behaviour of banks: the share of bonds from the Level 1 Periphery and Level 2a Periphery portfolios is at a similar level of 15.5% and 15.6%, respectively. However, the level is around 20 percentage points lower than in comparable portfolios (level eurozone: 35.7%, Level 2a overseas: 37.6%). The distinguishing criterion appears to be regional origin rather than level allocation.
In the course of LCR regulation, banks can use different assets to cover their cash outflows. While covered bonds are not categorised as Level 1 assets under the BIS regulation and are only recognised as Level 2a securities,banks can use covered bonds as Level 1 assets within the EU and the EEA if certain criteria are met. In our view, this leads to a situation where banks regularly invest in covered bonds and use them in addition to other asset classes, such as sovereign bonds and SSAs. According to BIS and EBA Data the amount of covered bonds in LCR portfolio are substantial but the overall share is with around 7% as of June 2016 limited. The share of covered bonds in LCR portfolios of banks have declined since 2011 also the overall amount is stable since then. So we believe that covered bonds are a diversification alternative for banks for composing their portfolios especially with the high share of public sector assets of around 50% in 2016. However, banks appear to be operating in an exceedingly price-sensitive way, on the primary market at least. Based on the data available, evasive movement has been evident for Level 1 covered bonds since the introduction of the CBPP3, as the involvement of banks has been declining for transactions from core eurozone issuers, in particular, while the share of Level 1 covered bonds that do not qualify for the purchase programme on account of their geographic origin has increased. As a similar trend is not apparent for Level 1 covered bonds from the periphery, owing to the low spreads for core eurozone issues, we assume that banks will focus on other Level 1 covered bonds that offer a higher spread. Due to the requirements for transparency in cover pool reporting within the framework of Art. 129 (7) of the CRR, the quality of reporting has in our opinion steadily improved, with the introduction of a standardised reporting standard based on the HTT playing an instrumental role in this development. The application of a uniform format enables investors to carry out their reporting obligations efficiently under the CRR and complete allocation within the framework of the LCR together with consideration of other factors. In our view the reporting requirement has in this way led to a much more disciplined reporting behaviour of issuers.


The European Covered Bond Council (ECBC) is the platform that brings together covered bond market participants including covered bond issuers, analysts, investment bankers, rating agencies and a wide range of interested stakeholders.


