19 November 2018

This article is taken from the 2018 edition of the ECBC European Covered Bond Fact Book, which can be accessed here.
The international Covered Bond benchmark segment, which started as an interbanking market-making (head to head) market in the 90s, transformed during the crisis into a pure client (investor) market-making market. This makes the Covered Bond market very much comparable to the Sub-Sovereign and Agencies (SSA) and Sovereign market. A functional REPO market constantly increases the liquidity of the Covered Bond market, as a consequence the Covered Bond benchmark market is one of the most liquid market segments. There are still two camps, one which views Covered Bonds thanks to the nature and the rating as part of the rates world, the other which clearly see credit elements and would value Covered Bonds as the strongest product of the credit world.
As any other market in the rates or credit world, the Covered Bond market faces regulatory requirements which result in a more prudent approach to trading books in terms of balance sheet allocation. In short, bank inventories have gone down and often only axed trading books are able and willing to show competitive prices and sizes to investors.
We continue to see the trend that 500mln € is becoming more and more the standard benchmark size for issuers, although issuers with larger annual funding appetites still favour a 1bn € deal or larger. In the US $ market the 1bn and even larger is the standard however a few examples in the last 1-2 years also proved acceptance of the 500mln $ benchmark. The Swedish or Danish Kroner Covered benchmarks are often significant by size and therefore far larger than the Euro or Dollar benchmarks. Obviously smaller benchmark volumes often lead to smaller secondary turnovers given that the various Covered Bond markets are dominated by a majority of buy and hold investors. Furthermore, redemptions have also been at rather high levels in the past few years, resulting in negative net supply, although this trend has so far not emerged in 2018. Still, the covered bond market shrank between 2013 and 2017. As a result, the volume of outstanding bonds has shrunk by around EUR 120bn in the past few years, a situation which has not been corrected by the purchase of covered bonds by the Eurosystem. Overall, new jurisdictions such as Singapore, Turkey, Poland, Korea and others are helping to address the net issuance reduction, however their activity has still not been enough to stop the trend. So far in 2018, gross issuance has been in excess of EUR 30bn more than redemptions.
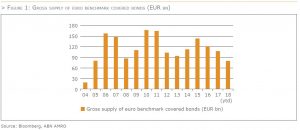
In summary, lower net supply, new deal size developments, a change of regulatory requirements and the nature of the investor base have a direct impact on secondary liquidity. Gross supply of euro benchmark covered bonds clearly increased up to 2015, although it has slowed down somewhat in the past two years. Further to a decline in 2012 and 2013, gross issuance started to pick up again in 2014, supported by an increase in both the number of new issuers as well as a rise in the amounts issued from jurisdictions outside the euro area. In 2015, the rise in gross supply of euro benchmark covered bonds was due to increased issuance from banks located within the euro area. This was related (at least partly) to the Eurosystem’s CBPP3, which has made it increasingly attractive for banks to issue covered bonds. However, the rise in gross supply from euro area issuers was fully offset by primary allocation to the Euro area central banks under CBPP3. Therefore, on a net basis, there was no increase in supply as available volumes to traditional investors decreased. In 2016, gross supply dropped again, mainly driven by a decline in issuance from banks located within the euro area. This, in turn, was largely due to the TLTRO2, which allowed these banks to borrow very cheaply (possibly at negative rates) at the central bank and non-covered issuance driven by regulatory changes to bolster banks capital structure. As a result, some covered bond funding appears to have been replaced with TLTRO2 borrowings. Therefore, in the end, the actions of the Eurosystem (CBPP3, TLTRO2) dampened turnover and reduced liquidity in 2015 and in 2016, with the size of the traded volumes dropping remarkably.
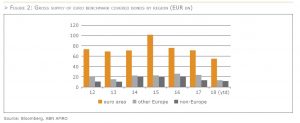
In 2017, gross issuance slowed down further, however this was mainly related to less issuance from banks outside the euro area, and Canadian banks, in particular. So far in 2018, euro area banks have been issuing relatively large amounts, probably as they prefer to make use of the good conditions in the primary market, still benefitting from CBPP3. However, non-EU banks have also been rather present in the primary market, with Canadian banks increasingly showing their face again (which partly reflects the fact that Canadian banks will be faced with higher redemptions than in previous years).
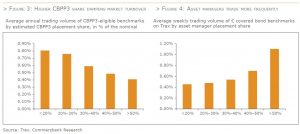
Although many traditional covered bond investors have also become mainly long term investors for various reasons, the graphs below clearly indicate a higher placement share with fund managers or a high oversubscription level usually goes hand in hand with greater trading activity on the secondary market. To summarise, the CBPP3 purchases appear of course to have impacted covered bond’s trading volume.
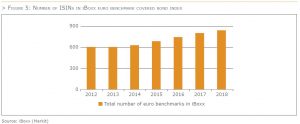
Meanwhile, the number of benchmarks outstanding in the Markit iBoxx euro covered bond index has steadily increased in recent years. In May 2018, the iBoxx included 837 benchmarks, which was up from 774 a year ago and which is some 200 more than at the end of December 2014. However, the sum of the nominal value of the benchmarks has risen by a much smaller number, reflecting the decline in average deal size. Still, the number of flavours that investors can choose from has increased, which in the end should support liquidity.
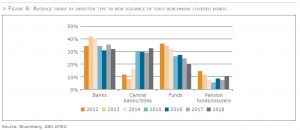
Let us again look at the evolution of investor base as an angle for liquidity. If the share of buy-and-hold investors has risen in the past few years, this should have reduced liquidity of covered bonds. The graph below shows the average share per investor type in new euro benchmark deals. The graph clearly illustrates the crowding out impact of CBPP3. The share of central banks/SSAs has risen sharply, actually quadrupling from around 8% in 2013 to around 30% now. This has come at the expense of other investors, such as banks, asset managers and institutional investors. However, asset managers have seen the biggest drop in their share. As these can be regarded as the most active portfolio managers, it seems fair to conclude that the change in the investor base in recent years has not supported liquidity of covered bonds.
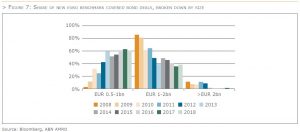
Finally, the larger the issue size, the better the liquidity. But also in this case, it seems that recent developments point in the direction of reduced liquidity. The graph below depicts the share of new deals broken down by issue size. The share of deals with an issue size below EUR 1bn increased strongly in recent years. Whilst only 3% of the deals had a size smaller than EUR 1bn in 2008, more than 60% of deals had such a size last year. In contrast, only 1% of new issues had a size above EUR 2bn in 2017 (as well as in 2018 so far). Mean-while, the share of deals sized between EUR 1bn and EUR 2bn started to drop sharply in 2010, now remaining roughly stable at just below 40%, which is only half of the share of such deals in 2009. So, from an issue-size perspective, it seems that liquidity has deteriorated rather than improved in recent years.
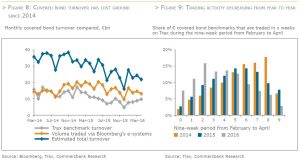
On first glance, trading volume from Bloomberg, the largest e-platform for covered bonds, has been relatively stable since 2014: the aggregated covered bond turnover (including non-benchmarks) from January to April 2016 amounted to €58bn, which compares to €59bn over the same period in 2014. This appears also to be in line with findings in a report on market liquidity and market-making of the European Systemic Risk Board from October 2016, which showed that trading volumes of covered bonds in the EU remained rather stable in the past four years. Still, this report showed that the median trade size of covered bonds had halved from about €8 million in 2009 to about €4 million. However, the turnover captured might have been supported by the fact that e-platforms have gained importance, not least due to CBPP3’s order process. After adjusting for a shift from voice to e-trading[1] the total covered bond trading volume estimated from the largest e-platform data tells a different story: Total turnover in 2016 actually decreased by around a third compared to two years earlier.
Direction and scope of this change are confirmed by MarketAxess’ Trax turnover volume. Trax statistics com-pile turnover figures from banks using the company’s post-trade services. As the data capture both voice and e‑trading they are not biased by a shift in the latter’s importance. Additionally, the weekly Trax data show how trading activity has decreased for individual instruments: From February to April 2016, c. 8% of € benchmark covered bonds have not been traded at all. Two years ago, that percentage was below 2%. The share of bench-marks traded less than every other week has doubled from 30% to 60% from 2014 to 2016. Usually, weekly turnover does not exceed €5m per bond. Although Trax data does not cover all trades in the market, these figures give an impression of the magnitude of the volume drain on the covered bond market.
The density of turnover driven by private investors has, of course, fallen by a higher amount. After all, one has to adjust the total turnover for the CBPP3 secondary market purchases. This first requires some mathematical adjustments to the monthly figures reported by the ECB (as they are based on amortised costs rather than nominal levels etc.). On balance, in our model calculation CBPP3 purchases account for around a fifth of overall secondary market turnover.
While the turnover reduction appears substantial, its causes are not that clear cut. As it is accompanied by the central banks’ QE measures, the idea that CBPP3 has supported the activity drain seems plausible at first glance, as it has crowded out other investors (see above). However, it is difficult to isolate the influence of this factor on the trading volume of € covered bonds and to estimate its magnitude. After all, volume has several other determinants and many of them apply to other covered bond or fixed-income segments as well, i.e., do not negatively affect the relative liquidity of € benchmarks. One of the most important turnover drivers is, of course, the volume outstanding: Around two-thirds of the turnover in Euro benchmarks is made up of covered bonds from Spain, Germany, France and Italy. This is predominantly due to the size of these segments as € benchmarks in jumbo size, e.g., have on average double the trading volume than benchmarks with less than €1bn of nominal outstanding. When adjusted for size, the difference between both segments wanes. Therefore, the steadily decreasing size of new € benchmarks over recent years seems to have had a negative impact on volume.
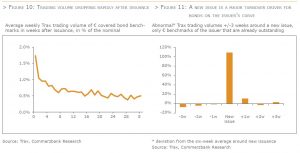
Another important turnover factor is the primary market. For one, a bond’s age determines its trading volume. A new benchmark loses three quarters of its initial trading volume in the first four weeks after issuance. Thereafter, weekly turnover only amounts to 0.5% of the nominal volume on average, with a declining tendency. A lively primary market that limits the average age of the outstanding bonds therefore is positive for a market’s trading volume. For another, switching interest induced by new issues is one of the most important turnover driver particularly for segments that lack a genuine trading activity. Roughly speaking, Trax trading volumes of an issuer’s covered bonds outstanding[2] on average doubles in the week, where the bank launches a new benchmark. Trading volumes of other covered bonds in the issuer’s country climb by around one fifth. Individual examples show that the switching interest may even set in as soon as several weeks before the actual pricing of a new deal, in case there is a roadshow ahead. Hence, the lively issuance activity since autumn 2015 should have spurred the trading activity up until now on the covered bond market.
In addition, we see – thanks to the change and future indications of ECB policy – the increase in importance of traditional investors for the Covered bond market. As a result – the percentage of bonds which are not by definition buy and hold – have significantly increased, which will likely also increase the liquidity of bonds and direct and indirect impact trading activities. In addition, change of central bank policies are possibly increasing volatility, volatility increases the likelihood of directional trading activities by all market participants. This observation is not limited to the jurisdictions which were in scope of these open market activities, other not in scope jurisdictions are clearly no different.
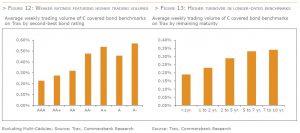
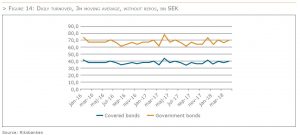
Trading volume is also influenced by factors that are not directly liquidity-related. For instance, higher-beta covered bonds tend to feature higher trading activity. Trax turnover of benchmarks featuring a single A as second-best rating, for instance, came in around twice as high as for AAA rated instruments, relative to their volume outstanding. Multi Cédulas also register higher relative trading volumes than Single-name Cédulas. Moreover, turnover is greater in bonds with a longer remaining maturity and thus higher duration. Among other things, this beta bias should be due to the fact that, since the sovereign debt crisis ebbed, active investors have relied to a greater degree on volatile names to generate outperformance while buy-and-hold clients prefer stable qualities.
After the financial crisis, liquidity in fixed income markets has changed – including covered bonds as significant part of the fixed income world. Market participants have adjusted and adapted their investment behavior thanks to new regulatory requirements and investments goals. Liquidity in fixed income including covered bonds nowadays has to be measured differently, and despite a slight shrinking issuance volume trend and significant participation from regulators, covered bonds and market participants in covered bonds have demonstrated that the product continues to plays an anchor role in various funding, trading and investment activities.
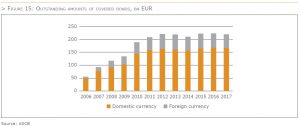
The Swedish domestic market for covered bonds is of great importance for the domestic capital market. Before Sweden implemented a law for covered bonds in 2004 a liquid market for mortgage bonds had been around since the beginning of the 80s. The outstanding volume of covered bonds in SEK was EUR 165,9 bn at year end 2017. That was nearly twice as much as outstanding volume of government bonds.
Swedish bond market investors appreciate liquidity. The large banks issue their covered bonds as benchmarks which mean that large amounts are issued and that a number of dealers are contracted to show both bid and offer prices. Also, only benchmarks are deliverable in the future contracts. When a new benchmark-bond is is-sued, the issuers make sure that the amount issued meets the requirements for a benchmark sized deal. After the initial day of issuance, the issuer can, without further notice, issue “on tap”. The benchmark bonds can be up to SEK 60 bn in size. Sweden has a liquid and smoothly operating repo market with almost all banks and broker firms involved in the trading. The issuers offer their market makers a repo-facility in their own bonds. The repo transaction is viewed as a ‘sell-buy back’ or ‘buy-sell back’ deal and the ownership of the security has to be transferred.
Overall, this system has been working for a long period of time. The new regulations with higher capital requirements, greater information requirements (MiFID II) and other potential obstacles for example, the leverage ratio, structural reforms and so on will have a negative impact on liquidity in a small market such as the Swedish market. The Swedish Central Bank (Riksbanken) has been aggressive in its Quantitative Easing (QE)- policies which means that the central bank now owns a large part of outstanding government bonds. The Riksbank is not aiming to buy covered bonds in their QE. Activities in the market will however suffer from the QE-operations. This far turnover is not significantly lower and the local FSA has performed studies of the liquidity in the covered bond market. The result of that study is that the liquidity is still good.
The type of bonds making up the Danish covered bond market fall into three major segments: callable bonds, bullet bonds and floater with or without a cap. All bonds are UCITS compliant and the vast majority is CRD compliant. The market comprises a great number of securities, but the vast majority of the nominal value is concentrated on a relatively small number of large series.
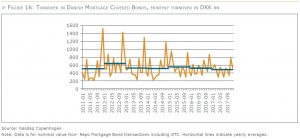
Reported trades in mortgage covered bonds (the Danish covered bond market – with an outstanding volume of EUR 393bn – is the largest market in Europe) to the Danish stock exchange, Nasdaq Copenhagen, including over the counter trades and excluding repos, show resilient turnover in 2017 compared to recent years. The number of trades in covered bonds is less than in stocks for instance, however average trade sizes are much larger.
Average monthly turnover in the period 2011 – 2017 came in at close to DKK 535bn (app. EUR 72bn). In 2017, average monthly turnover was DKK 479bn (app. EUR 64bn), cf. Figure 16, or approximately 17 percent of the outstanding volume, which is slightly below previous years.
Although not as pronounced as in 2015 repayment activity in fixed rate callable in 2016 and 2017 remained relatively high. Partly due to the high repayment activity, issuance of callable bonds in the primary market was once again a driver for turnover in 2017 even though their share of total issuance was declining. Meanwhile, as covered bonds issued outside the Euro area are not eligible for purchase under CBPP3, the Danish covered market has not been directly affected by quantitative measures by the ECB, which have been a major factor dampening transaction activity in the Euro area. However, an indirect effect cannot be ruled out. Again in 2017, foreign investors led by Japanese investors were net buyers of Danish covered bonds, absorbing almost the entire expansion of the Danish covered bond market in 2017. As a result, foreign investors extended their ownership share of Danish covered bonds from 26 percent by the end of 2016 to 26.3 percent by the end of 2017. Currently, foreign investors are having a positive effect on market turnover and liquidity, but longer-term effects remain to be seen.
Previously, the data was characterised by high turnover around the time of the November/December refinancing auctions of bullet bonds financing adjustable rate mortgages. Over the years, the spike has somewhat diminished as mortgage banks have spread the refinancing auctions from one to four annual settling periods, although this does not affect average transaction volume over the year.
Pass through, tap issuance, quarterly refinancing auctions and frequent early repayment activity are all characteristics of the Danish covered bond market, which among other more universal factors affect the level of market turnover.
The strict balance principle deployed by Danish mortgage banks incorporates pass through and means that mortgage covered bonds are tap issued on the go, in sync with demand for mortgage loans. Following the initial tap issuance, mainly bullet bonds and to an extent floaters, are refinanced by the issuance of new bonds at refinancing auctions over the life of the loan.
Another specific influencing liquidity in the Danish covered bond market is borrowers’ early repayments. Any Danish covered bond can be bought back by the borrower at the current market price and delivered to the issuing mortgage bank – the buy back option – or in the case of fixed rate mortgages be bought back at par. This type of early redemption activity gives rise to an increase in transactions both when bonds are bought back (the buy-back option), and when new bonds are issued. While not as pronounced as previous years, again in 2017 market developments encouraged early repayment activity.
Meanwhile, while not all implemented, liquidity rules including the LCR and NSFR, gearing ratio and capital requirements for market risk FRTB are already unintentionally increasing the cost of market making and repo transactions through increased capital requirements and stricter liquidity management rules.
Due to tap issuance, the market maker function of universal banks is handed a central role providing liquidity in the covered bond market, as professional investors are mostly unwilling to buy in small batches. Onwards, market makers remain the main source of liquidity in the Danish covered bond market. However, higher capital charges, liquidity rules and the low interest rate climate have put pressure on the profitability of market making. In 2015, the Central Bank of Denmark, Danmarks Nationalbank, found evidence that the five largest universal banks in Denmark have reduced their net positions available for market making by DKK 100bn since mid-2014[3].
To a lesser extent, market makers will be providers of market liquidity, rather than makers between buyers and sellers in the market. In 2016 Finance Denmark conducted a qualitative interview-based study among investors to explore how they perceive the evolution of the market making function. The results show that, compared to ten years ago, the execution of trades above DKK 500 million takes longer and move prices more. While market makers have reduced holdings, on the receiving end have been, among others, institutional investors, which could also lead to lower turnover going forward.
Although approximately 80 percent of the outstanding volume of mortgage covered bonds are in series sizes above EUR 500 million, giving rise to an LCR classification of Level 1B for the AAA rated Danish covered bonds, the new liquidity rules, create a challenge in managing smaller series sizes. If investors are unsure if a bond series will reach the critical mass – as bonds are tap issued – to qualify as Level 1B- or Level 2A- assets under the LCR, the pricing of the specific series may be negatively affected. This is an issue also affecting market makers.
In cases where the turnover has remained more or less on par with previous years, repo activity has declined since 2012; again in 2017 repo turnover was limited compared to earlier years. The decline in the covered bond repo market is a consequence of the stricter capital and liquidity requirements mentioned above, while the lower yield spreads between covered bond and repo rates are also squeezing hedge funds out of the repo market.


Established in 1967, the European Mortgage Federation (EMF) is the voice of the European mortgage industry on the retail side of the business, representing the interests of mortgage lenders at European level.


