26 October 2017

By Matthias Melms, NordLB, Franz Rudolf, UniCredit and Maureen Schuller, ING BANK
This article is taken from the 2017 edition of the ECBC European Covered Bond Fact Book, which can be accessed here.
Initiated in September 2014 by the ECB and later embedded in a broader asset purchase programme, the covered bond purchase programme (CBPP) is currently scheduled until year-end 2017. It has been a major driver for the covered bond market since its implementation. The article addresses the criteria and mechanism of the purchase programme, the development of ECB’s covered bond portfolio following termination. The article concludes with a scenario analysis following the tapering/ending of the programme including the potential impact on spreads.
On Thursday, 4 September 2014, the European Central Bank (ECB) announced its plan to buy covered bonds. This covered bond purchase programme (CBPP) came as a surprise to markets at that time and was the third covered bond purchase programme besides the CBPP1 (from July 2009 to June 2010) and the CBPP2 (from November 2011 to October 2012). Purchases of the CBPP3 started at the end of October 2014. The CBPP3 programme was originally scheduled until October 2016. In January 2015, however, it was embedded in a broader asset purchase program (APP), including sovereign debt as well as international and supranational institutions and agencies with a monthly target volume of EUR 60 bn. In December 2015, the ECB asset purchase program was extended to March 2017 and the monthly volume was increased to EUR 80 bn in March 2016, including also corporate bonds from June 2016 onwards. After two years in operation, the ECB announced in December 2016, that from April 2017 onwards, monthly purchases under the APP are reduced to EUR 60 bn from previously EUR 80 bn, while at the same time extending the term of the program until year-end 2017.
The ECB’s rational is that alongside the public sector programme (PSPP), the asset-backed securities (ABS) purchase programme (ABSPP), the corporate sector purchase program (CSPP) and the targeted longer-term refinancing operations (TLTROs), the CBPP3 will further enhance the transmission of monetary policy, facilitate credit provision to the euro area economy, generate positive spill-overs to other markets and, as a result, ease the ECB’s monetary policy stance, and contribute to a return of inflation rates to levels closer to 2%.
The purchases are conducted in both primary and secondary markets in a uniform and decentralised manner, meaning that the Eurosystem central banks purchase eligible covered bonds from eligible counterparties. In order to qualify for purchase under the programme, covered bonds must fulfil the following eligibility criteria:
Be eligible for monetary policy operations in line with section 6.2.1 of Annex I to Guideline ECB/2011/14 (eligibility criteria for marketable assets) and, in addition, fulfil the conditions for their acceptance as own-used collateral as laid out in section 6.2.3.2. (fifth paragraph) of Annex I to Guideline ECB/2011/14.
> Be issued by euro area credit institutions; or, in the case of multi-Cédulas, by special purpose vehicles incorporated in the euro area.
> Be denominated in euro and held and settled in the euro area.
> Have underlying assets that include exposure to private and/or public entities.
> Have a minimum first-best credit assessment of credit quality step 3 (CQS3; BBB- or equivalent) by at least one rating agency.
> For covered bond programmes which currently do not achieve the CQS3 rating in Cyprus and Greece, a minimum asset rating at the level of the maximum achievable covered bond rating defined for the jurisdiction will be required for as long as the Eurosystem’s minimum credit quality threshold is not applied in the collateral eligibility requirements for marketable debt instruments issued or guaranteed by the Greek or Cypriot governments, with the following additional risk mitigants: (i) monthly reporting of the pool and asset characteristics; (ii) minimum committed overcollateralisation of 25%; (iii) currency hedges with at least BBB- rated counterparties for non-euro-denominated claims included in the cover pool of the programme or, alternatively, that at least 95% of the assets are denominated in euro; and
(iv) claims must be against debtors domiciled in the euro area.
> Covered bonds issued by entities suspended from Eurosystem credit operations are excluded for the duration of the suspension.
> Counterparties eligible to participate in CBPP3 are those counterparties that are eligible for the Eurosystem’s monetary policy operations, together with any of the counterparties that are used by the Eurosystem for the investment of its euro-denominated portfolios.
> The Eurosystem will apply an issue share limit of 70% per ISIN (joint holdings under CBPP1, CBPP2 and CBPP3), except in the case of covered bonds issued by issuers in Greece and Cyprus and not fulfilling the CQS3 rating requirement; for such covered bonds, an issue share limit of 30% per ISIN will be applied.
> Covered bonds retained by their issuer shall be eligible for purchases under the CBPP3, provided that they fulfil the eligibility criteria as specified.Furthermore, the Governing Council has decided to make its CBPP3 portfolio available for lending. Lending will be voluntary and conducted through security lending facilities offered by central securities depositories, or via matched repo transactions with the same set of eligible counterparties as for CBPP3 purchases. Compared to the CBPP1 and CBPP2, the current purchase programme (CBPP3) did not apply any minimum size or any specific maturity of the covered bonds purchased.
In June 2009, the ECB had announced its first covered bond purchase programme (CBPP1) with a volume of EUR 60 bn – with purchases between July 2009 and June 2010. The programme was fully used with a nominal value of EUR 60 bn, and, in total, 422 different bonds were purchased, 27% in the primary market and 73% in the secondary market. The Eurosystem mainly purchased covered bonds with maturities of three to seven years, which resulted in an average modified duration of 4.12 for the portfolio as of June 2010. In November 2011, the ECB launched its second covered bond purchase programme (CBPP2) with a programme size of EUR 40 bn and eligible covered bonds to be purchased up until October 2012. However, cumulative purchases reached only a volume of EUR 16.4 bn, of which 36.7% related to the primary market and 63.3% to secondary markets.

As of 23 June 2017, the ECB reported covered bond holdings of EUR 222.84 bn under the CBPP3 at amortised cost, deriving from primary market (33%) and secondary market sources (67%). In addition, the remaining holdings from terminated covered bond purchase programmes were reported as EUR 7.9 bn under the CBPP1 and EUR 5.4 bn under the CBPP2.
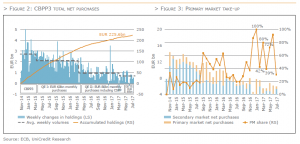 After the Eurosystem started to buy public sector securities under the public sector purchase programme (PSPP) in March 2015, the purchases under the CBPP3 have gradually softened. The ECB’s decision in March 2016 to expand the monthly purchases under its asset purchase programme (APP) from EUR 60 bn to EUR 80 bn per month did not change this trend. The declining covered bond purchase volumes continued following the reduction of monthly purchases to EUR 60 bn per month announced in January 2017. A case in point is the declining share of the CBPP3 in the asset purchase aggregate. This share was 15% on average in 2015, 7% in 2016 and 4% in 2017 year-to-date.
The more moderate buying activity has been most notable in the secondary market. In the period from October until September 2015 the gross secondary purchases (unadjusted for redemptions of CBPP3 holdings) have been EUR 7.5 bn on average and dropped to an average of EUR 3.3 bn in the first five months of 2017. With secondary market purchases declining continuously due to dried-up markets, the dependence on primary market purchases increased. This led to higher volatility in the primary vs. secondary market shares, depending on the available eligible new supply in the respective period, demonstrated especially since December 2016 (see Figure 3).
In 2016, Draghi announced that the Eurosystem would, in future, reinvest assets back in the market in order to maintain the ECB’s stable balance sheet total. We understood the statement to mean that the maturing purchases would be reinvested in the same asset class again. This means that even after the end of the purchase programme, the ECB will be active in the market and support it with reinvestments.
This calls for an assessment of when these purchases are expected to reach maturity. When compared with the PSPP and the CSPP, different conditions apply for the covered bond purchase programme. The Eurosystem is able to operate on both the primary and secondary markets. In addition, the limit per ISIN is at a high level of 70% and therefore also enables a substantial accumulation of individual securities. In contrast to the other programmes, no information is provided about the ISINs that are being purchased, which means that the composition of the Eurosystem’s CBPP3 portfolio is not known. Through purchases on the primary and secondary markets, the volume of the CBPP3 portfolio as at the end of May amounted to EUR 219.9 bn, of which EUR 71.8 bn was attributable to the primary market and EUR 148.1 bn to the secondary market. From the average number of purchases per month, it becomes clear that the primary market activities of the Eurosystem have been consistently between EUR 1.7 bn (2014) and EUR 2.6 bn (2015). By contrast, the average monthly purchase volume on the secondary market amounted to just EUR 1.0 bn in 2017 and is therefore only a fraction of what it was at the start of the purchase programme (2014: EUR 8.1 bn).
Not only is information on the volume of completed purchases not available (only in aggregate form), there is also no data on the maturity structure of the portfolio. Consequently, there is no transparency in this regard. Therefore, we intend to better understand the Eurosystem’s portfolio on the basis of information that is available to at least get an idea of the structure. We have therefore analysed the activities on both the primary and secondary markets to subsequently build an overall portfolio from this information. Where no data was available, we have worked on the basis of assumptions that will be explained where relevant.
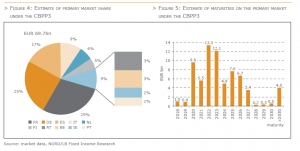
According to ECB information, EUR 71.8 bn has so far been acquired on the primary market within the framework of the CBPP3 by end of May. This equates to 32% of the overall purchase volume. However, information about the specific ISINs that were invested in and the investment amount is not publicly available. To better understand which covered bonds from what countries and with which maturities were invested in, we have evaluated all available deal reports (282) for benchmark transactions (benchmark = issue volume of at least EUR 500m, investment grade, publicly placed, at least three joint leads involved) by issuers from Eurozone countries that qualifies under the criteria of the programme since the actual start of the programme in October 2014. After the transaction, the deal statistics about investors participated in the deal are provided by the joint leads. These deal statistics do not specifically mention investors by name, which means they will not contain information on the participations of the ECB or the national central bank responsible for carrying out the transaction. However, investors are divided into groups. Generally, this comprises banks, fund or asset managers, insurance companies, pension funds and also central banks/SSAs or official institutions.
While the allocation to the investor group of central banks/SSAs averaged at 10.4% across all transactions from Eurozone issuers between 2011 and September 2014, the share increased to 36.1% in the period from October 2014 to May 2017. From this, we can surmise the working hypothesis that of all bonds that qualify for the purchase programme, the allocation attributable to the CBPP3 is lower than 36.1% due to other central bank demand as was observed before the implementation of the programme. Based on this working hypothesis, this generates a theoretical value of EUR 69.7 bn allocated to the Eurosystem on the primary market in the course of the CBPP3. As the volume actually reported by the Eurosystem is EUR 68.9 bn, we are confident that our figures based on estimates are sufficiently representative of actual primary market activity. On the basis of this data, EUR 20.0 bn (28.6%) of primary market activity is attributable to French bonds, followed by issuances from Germany of EUR 17.2 bn (24.7%) and Spanish Cédulas with a volume of EUR 11.8 bn (16.9%).
The maturities of primary market transactions are distributed across the years 2018 and the following years, with our estimates putting the final portfolio maturities in 2037 (ABNANV 1 3/8 01/12/37 and 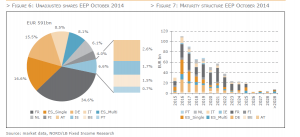 ACACB 1 1/2 02/03/37). While only a very low volume from primary market transactions reaches maturity in 2018 (EUR 1.0 bn) and in 2019 (EUR 0.8 bn), the volume increases significantly to EUR 9.6 bn in 2020 and will be no less than EUR 4.9 bn (2024) every year up to 2026. In 2027, the maturing volume drops to EUR 3.7 bn and will then remain at a low level in subsequent years.
The reported volume that the Eurosystem has acquired on the secondary market since the launch of the programme amounted to EUR 148.1 bn as at the end of May. However, it must be considered that, according to our understanding, this is a reported net volume and therefore already includes reinvestments that have been made from bonds which have reached maturity and also quarterly portfolio adjustments. In addition, the volume includes all secondary market purchases, regardless of the size of the bonds. To get an idea of the maturity structure of the secondary market portfolio, we have restricted our analysis to focus only on benchmark bonds. On this basis, we have created a sample portfolio on a monthly basis of all covered bonds that qualify for the purchase programme (ECB eligible portfolio = EEP). For example, the sample portfolio in October 2014 comprises an overall volume of EUR 591 bn. Of this, French covered bonds accounted for a share of 34.6% (EUR 204 bn), followed by Spanish single Cédulas of 16.6% (EUR 98 bn) and German Pfandbriefe of 15.5% (EUR 92 bn). Acknowledging the fact that the composition of the EEP is not consistent with the shares that national central banks hold in the ECB and of which we assume that the percentage capital shares should also still reflect the EEP composition, we have also taken this into account in the portfolio composition, whereby we do not anticipate any great deviation in a comparison of maturities between an unadjusted portfolio and a portfolio adjusted for the percentage shares in the ECB. We contrasted the EEP calculated for each month with the reported ECB purchases, whereby we supposed a distribution in line with the distribution of the EPP.
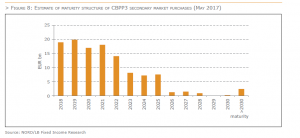
The estimate obtained in this way for the secondary market share of the CBPP3 portfolio comprises a portfolio volume of EUR 140 bn, with the maturity structure revealing that between EUR 15 bn and EUR 20 bn in covered bonds will be repaid each year up to 2021. While EUR 13 bn is still due for redemption in 2021, the figure falls considerably in the subsequent years and will drop below EUR 2 bn in 2026. Finally, after 2030, only small amounts are due to mature in some individual years.
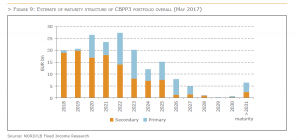
In order to gain an overall picture of the maturities in the portfolio as a whole, we have combined the maturity structures for the assumed primary market and secondary market purchases. Overall, this enabled us to establish a volume of around EUR 210 bn, which is roughly equivalent to the portfolio volume of EUR 220 bn published by the ECB as at the end of May. Based on this structure, a volume of between EUR 19 bn and EUR 26.6 bn is currently due to reach maturity between 2018 and 2023, with a peak figure of EUR 26.6 bn in 2022.
This would result in monthly purchases of around EUR 2.0 bn to EUR 2.5 bn over this period. However, this analysis has not taken into account that reinvestments will in themselves lead to an extension of the portfolio structure. Based on the current estimates, reinvestment in the year t0 would increase the maturities over the next six years (t1 to t6) by a respective 11% of the volume reaching maturity in t0.
For example, reinvested maturities of EUR 19.4 bn in 2018 would increase the respective maturities between 2019 and 2024 by EUR 2.1 bn each year. Accordingly, the maturity profile for subsequent years up to 2031 would grow by EUR 1.0 bn each year. This reinvestment effect means that the maturities which have been estimated today would rise from EUR 25.9 bn to EUR 30.4 bn in 2020. This effect will last as long as the Eurosystem reinvests the maturities in the covered bond market.
The simulation of the maturity structure of the CBPP3 portfolio shows that maturities span a very broad period of more than 20 years, although 97% of the estimated portfolio will fall due in the next ten years. As a result, until reinvestments come to an end, an average of between EUR 2.0 bn and EUR 2.5 bn on a monthly basis will be reinvested on the covered bond market and will consequently provide a degree of stability for the market. Moreover, the reinvestment effect will only serve to strengthen this up to the point the ECB decides either to run down its balance sheet total or to allow maturities to be reinvested in other asset classes. Overall, however, the volume of maturities and therefore reinvestments are smaller than is often speculated on the market, as the volume spreads over a longer period of time.
As partly discussed above, the ECB has taken various extraordinary measures to implement monetary easing over the last several years:
1. Lowering interest rates (main refinancing rate to 0%, deposit rate to -0.4%);
2. Asset purchase programmes (CBPP3, PSPP, ABPP, CSPP); and
3. Unlimited access to central bank funding via the refinancing facilities (including multi-tranche LTROs).
Based upon experience in the US, the most likely course of action for the ECB to reverse this phase of monetary easing is to gradually reduce (i.e. taper) its net asset purchases, before it proceeds with tightening measures such as shrinking its balance sheet by not reinvesting maturing bonds into new debt or by raising interest rates.
The previous section provided an overview of the support that is likely to persist for the covered bond market if the ECB continues to reinvest maturing bonds once the net purchases have been reduced zero. In this section we discuss three different hypothetical tapering scenarios with reference to the net asset purchases.
Under scenario 1 the ECB will promptly stop adding new securities to its suite of portfolios under the asset purchase programmes by the end of 2017. Maturing bonds will continue to be reinvested. Reinvestments are assumed to be made within the same asset class as the maturing bonds. Given the share of debt already held by the ECB within the respective bond markets, the APP is most likely to target fresh issuance for reinvestments either directly in the primary market (where allowed) or subsequently in the secondary market.
Scenario 2 is predicated on the notion that the restrictions to the public sector purchase programme will force the ECB to moderate its asset purchase pace next year from the current EUR 60 bn monthly target. We assume that the ECB already holds 75% of the eligible debt it can buy under the public sector purchase programme before it reaches the 33% ISIN limitations under this programme. This gives the ECB room to run the asset purchase programme at the current net monthly buying pace of EUR 60 bn (of which 85% is spent in public sector assets) until the end of March 2018. Rather than abruptly ending the programme at that time, we assume the ECB will lower its net monthly asset purchases from EUR 60 bn to EUR 30 bn as of January 2018, before the central bank reduces the net purchases to zero by the end of June 2018.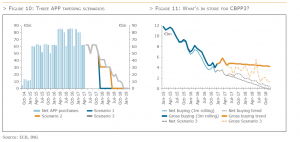
The scenario 3 sees the ECB expanding the scope of its asset purchase programme to facilitate a slower tapering of purchases. For instance, if the ECB were to broaden the scope of its buying programme to include shorter maturity public sector bonds with a maturity less than one year, the central bank would have an additional few months, i.e. until the end of 2018, to reduce the net asset purchases to zero.
Figure 10 depicts the monthly buying path under all three scenarios. Although ECB policy officials have indicated that they may even increase the size or duration of the asset purchase programme if economic conditions deteriorate, the number of options on the table to effectively do so have become fewer. Hence, even scenario 3 assumes tapering and only a modest extension of the duration of the programme until the end of 2018. Under none of these foregoing scenarios, we consider it likely that the ECB starts replacing a reduction in public sector purchases with an increase in investments under its other purchase programmes.
As mentioned above, the ECB is already a significantly less active buyer of covered bonds than it was at the beginning of the programme. Figure 11 gives an overview of the CBPP3’s net and gross (including reinvested redemptions) monthly buying pace on a three month rolling basis since 2015. Both net and gross purchases have gradually trended lower during the course of the CBPP3, even after expansion of the asset purchase programme. Since the beginning of this year the reduction in net and gross purchases has become more gradual than in the past two years. Furthermore, the impact of the reinvestment of redemptions has become more meaningful, resulting in a wider gap between gross and net monthly purchases.
This year’s flatter net purchase trend (depicted in grey in figure 11) would not see net buying end until November next year. Under the steeper declining purchase trend observed in 2015-2016 (depicted in blue in figure 11), this would already occur in the second half of this year. Continuation of this year’s flatter gross buying trend results in gross monthly CBPP3 purchases of over EUR 4 bn for most of next year. This is not a realistic assumption, not even under our most optimistic of hypothetical tapering scenarios (scenario 3).
Indeed, tapering scenario 3 for the APP estimates that net purchases end before 2019 (dotted thin grey line in figure 11). If the share of the CBPP3 within the APP remains constant at around 4.5%, the decline in net covered bond purchases will set in modestly later in scenario 3 than indicated by this year’s net buying trend (represented by the thin grey line in figure 11). Hence, in scenario 3 net covered bond purchases exceed the estimated net purchase trend in 2018.
It is quite different for gross purchases. Even if next year’s redemption payments to the CBPP3 are reinvested completely in covered bonds, gross buying activity will trend lower at a firmer pace in scenario 3 (thick dotted grey line) than based upon the current trend (thick grey line). In scenario 3 4Q18 gross buying would be around EUR 1.5 bn compared with EUR 4 bn based upon this year’s gross buying trend.
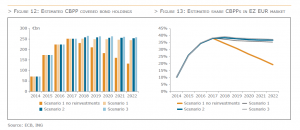
Total CBPP covered bond holdings aggregated to EUR 233 bn at the end of May 2017, c. 37% of the Eurozone EUR benchmark covered bond debt outstanding. We estimate that total covered bond holdings will exceed EUR 250 bn by the end of this year, before our tapering scenarios kick in (figure 12).
In December 2015 the ECB announced intentions to reinvest repayments of securities bought under the APP for as long as necessary. In the past five years, Eurozone banks have issued on average EUR 83 bn per year in EUR benchmark covered bonds. Reinvestments of covered bond redemptions, if done via primary, would coincide with a CBPP3 take up in new deals of 23% to 33% per annum at similar supply volumes. This is comparable with the 31% average take-up of Eurozone primary deals during the CBPP3.
Figure 12 gives an overview of the total prospective covered bond holdings under the three scenarios envisaged above. If redemptions are reinvested in full, the amount of covered bonds held by the ECB in five years’ time would still be between EUR 245 bn (scenario 1) and EUR 260 bn (scenario 3). If the ECB were to stop buying covered bonds by the end of this year and redemptions were not to be reinvested, the central bank’s covered bond portfolio would shrink to just below EUR 135 bn in 2022.
If the ECB continues to reinvest redemptions, CBPP holdings of Eurozone EUR benchmark covered bonds would still be 35% (scenario 1) to 37% (scenario 3) in five years’ time. Without reinvestment of redemptions, this percentage would decline to 19% by 2022. This is still well above the 10% share of the CBPP holdings at the start of the CBPP3 (figure 13). This underscores our expectation that the ECB will remain an important player within the covered bond market for quite some time, unless the central bank would at some point see the economic rationale to actively reduce its covered bond holdings by selling down its portfolio.
An analysis of historical covered bond spread developments during the course of the CBPP3, may give us important clues to the potential impact of tapering on spreads. To this purpose, we look at the interaction of covered bond spread developments with the following:
• The CBPP3’s secondary purchase support;
• Primary market activity;
• General spread dynamics in financials;
• Bund trading levels versus swaps; and
• Yield levels (swap rate).
However, before proceeding with our analysis it is important to bear in mind the dominant impact on performance of four distinct ECB policy announcements in the past three years, discussed in the second paragraph of this article (see figure 14):
1) 4 September 2014 – The ECB announced intentions to start buying covered bonds under the CBPP3
2) 22 January 2015 – The ECB announced that it would expand the asset purchase programme to include government bonds and SSAs. The total programme size was calibrated at EUR 60 bn.
3) 10 March 2016 – The announcement to expand the asset purchase programme to include corporate bonds, a new round of TLTROs, the lowering of the deposit rate to -0.4% and an increase in the size of
the programme from EUR 60 bn to EUR 80 bn.
4) 8 December 2016 – The ECB announced intentions to extend the term of the programme until the end of 2017 (from March 2017), while reducing the size of the programme to EUR 60 bn as of April 2017,
and to allow purchases to be made at a rate below the -0.4% deposit rate.
The mere announcement of these policy measures has proven to be of far more significance to performance than actual execution. This suggests that any hints from the ECB towards tapering will have the more definitive impact on spreads than the actual ultimate decline in purchases.
Besides the positive response of the covered bond market to the various QE announcements, covered bond spreads have been well supported by the CBPP3’s demonstrable presence in the secondary market until the summer of 2015. Figure 14 illustrates however, that the lower secondary buying pace since September 2015 coincided with a notable widening in covered bond spreads through until the ECB’s March 2016 meeting.
The slower secondary purchase pace in the second half of 2015 coincided with a strong pickup in Eurozone covered bond supply (figure 15). This abundance in fresh paper saw CBPP3 purchases shift away from secondary to the primary market, at a time that increasing supply was already pressuring covered bond spreads. This suggests that in the event of tapering, a decline in covered bond purchases would probably have to coincide with another performance negative such as high supply to trigger spread widening.

Figure 16 and 17 show the relationship between senior unsecured and covered bond spreads since the beginning of 2014 for France (CBPP3 supported) and Sweden (not supported). Indeed, during the first half of 2015 particularly CBPP3 supported covered bonds hardly widened while senior unsecured paper reflected demonstrable widening. The spread relationship between senior unsecured and covered bonds ahead of the CBPP3 shows that a stronger widening in covered bond spreads would have been on the cards without the support of the purchase programme. This was also noted in the Swedish covered bond market, where covered bonds spreads gapped out more substantially in line with senior unsecured spreads.
In the second half of 2015 senior unsecured bonds started to retighten while covered bonds continued to widen. The historical (i.e. pre-CBPP3) spread relationship between senior unsecured and covered bonds has been restored notwithstanding the fact that the ECB still buys covered bonds. This confirms our view that additional spread support for covered bonds from the CBPP3 was long since dissipated.

That said, the charts do illustrate that in 1Q16 non-CBPP3 supported covered bond spreads did peak beyond their 2014 highs ahead of the purchase programme, while CBPP3 supported bonds in fact did not. Hence, although CBPP3 supported covered bonds are expected to be as elastic in response to a general deterioration of credit market conditions as before, the performance prospects for non-CBPP3 supported jurisdictions may yet prove to be more favourable once the ECB completely detaches itself from the covered bond market.
Figure 18 gives an overview of the relationship between covered bonds and Bund asset swap spreads. More expensive Bund trading levels versus swaps are constructive to tighter covered bond spreads. So if Bunds start to underperform swaps within a tapering environment, we are likely to witness a concomitant widening in covered bond spreads. This may prove to be of more importance to the performance of covered bonds than the actual tapering of net purchases to zero under the CBPP3.
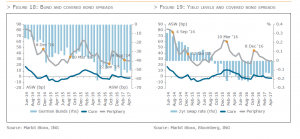
However, in addition to less supportive buying in government bonds we probably would have to witness a rise in underlying yield levels to support a widening in covered bond spreads to the levels seen prior to the ECB announcing its intentions to buy covered bonds in September 2014 (figure 19).
Figure 20 gives an overview of the spread implications of QE tapering in the US for US sovereign bonds and USD denominated covered bonds. The Federal Reserve’s first hint and subsequent market anticipation of tapering had a stronger impact on spreads than the actual start of the tapering process in December 2013 when the Fed made the first reduction to its monthly purchases from USD 85 bn to USD 75 bn. The subsequent USD 10 bn reduction per each Fed meeting had little negative impact on spreads. If anything, spreads even tightened.
The strongest widening in spreads occurred after completion of the tapering process, when the market started to anticipate the first Fed rate hike. After the first 25 bp hike at the end of 2015, Treasury spreads remained relatively stable. This suggests that an actual tightening of monetary policy, which at some point later this year will, according to the Fed, include a gradual reduction of reinvestments, is likely to have a stronger impact on spreads than the tapering of asset purchases.

Both the impact of QE announcements on spreads and the tapering experience in the US suggest that the spread implications for covered bonds may be more pronounced after the first indications by the ECB of tapering than during the actual tapering process itself. The prospect of no tapering will have stronger spread ramification than a slow tapering process in our view. Once the tapering of asset purchases is completed, the market is likely to anticipate the central bank’s next course of action in the form of tightening in financial accommodation. This could well trigger a notably stronger widening response than any of our tapering scenarios discussed herein.


Established in 1967, the European Mortgage Federation (EMF) is the voice of the European mortgage industry on the retail side of the business, representing the interests of mortgage lenders at European level.


