24 August 2017

Intro and methodology
The ECBC Statistics and Data Working Group has been collecting statistics on the outstanding volume and annual gross supply of covered bonds at year end for 14 years now. From the start its aim has been to provide a com- plete set of numbers that can serve as guidance for interested parties from issuers and investors to regulators.
The collection of statistics is a significant undertaking each year which is only possible thanks to the coopera-tion of the Working Group members, covered bond issuers and banking associations. One representative per country (the list of country representatives can be found on the ECBC website – here) undertakes the initial data collection by approaching each issuer separately in most countries. These figures are then cross checked on the basis of publicly available data by a small number of Working Group members. The 2016 numbers were cross checked by Agustin Martin from BBVA, Thorsten Euler from DZ Bank, Alexandra Schadow from LBBW, Matthias Melms from NordLB as well as myself and Hyuck Jong Won.
General remarks on the 2016 statistics
The aim of the ECBC statistics is to paint as realistic a picture of the actual market and picture relevant trends as accurately as possible. We had kept the methodology unchanged for two years after implementing more realistic public vs. private placement buckets in 2012 and the introduction of the number of programmes in 2013. For the 2016 numbers we have again decided to add a new element to the statistics.
A lot of attention has recently been given to maturity structures. After all, the EBA, European Commission and European Parliament have identifi maturity structures and especially maturity extensions as one of the features they want to see harmonised. The ECBC Covered Bond Label database already highlights the maturity structure of each labelled covered bond. We did, however, want to expand on this and show the breakdown by maturity structure for the whole covered bond market (labelled and non-labelled). Similarly to the ECBC Covered Bond Label, we have introduced three categories for the outstanding volumes as well as new issuance – hard bullet, soft bullet and conditional pass through (CPT). In many countries we were able to also backdate the information.
We have tried in the past and will continue to try to improve the quality of the data even for previous years. It is always possible that we miss a bond or still include a bond that has been repaid early (just think of retained covered bonds). Wherever we realize that there was a mistake in last year’s data we amend the numbers. As a result of this, there are some slight differences in the numbers for 2016 compared to what was published last year. In our view, these adjustments are perfectly normal and we would rather adjust historic data to refl a more realistic picture than mechanically hold on to data that was once published but proven incorrect.
Before going into the actual statistics, we want to make some general remarks about the figures which are necessary to interpret them correctly:
We have one last comment to make at this point. The ECBC Covered Bond Label has become a widely used tool by issuers. It covers 57.5% of the covered bond market at the end of 2016 (61.5% according to the lat- est figures of the latest figures of the Covered Bond Label from July 2017). Part of the ECBC label is the label database which lists all labelled covered bonds. When comparing the label statistics to those presented in the factbook there are some discrepancies in the public-private classification in especially Nordic countries such as Denmark and Sweden.
The reason for these discrepancies is the different market structure those two countries have where bonds are frequently tapped, repurchased and then tapped again. The label as well as the ECBC statistics definitions requires a bond to be listed as well as syndicated to be classified as public and while Danish and Swedish covered bonds are listed, the way they are issued doesn’t comply with the syndication requirement. In the ECBC statistics presented below we try to capture the ”liquid” part of the market with our classifications and in justified cases can be more flexible than the ECBC label database. We have therefore tried to eliminate the differences between both data sets wherever possible. But we have granted Denmark and Sweden an excep- tion and consider bonds that for the ECBC label database are classified as private as public as long as we are talking about liquid benchmarks by these two countries’ standards.
Evolution outstanding volumes 2016
Covered bond markets had been a growth story ever since we started collecting data for the ECBC statistics in 2003. Even the first crisis years did not put an end to this trend as there was sizeable public issuance even during those days and issuers used retained covered bond issuance to secure central bank liquidity. This trend did however come to an end in 2013 when the market contracted by 8% for the first time. 2014 was still characterized by a slight fall in volumes but the speed slowed down quite substantially (-4%). Since 2015 the downward trend in outstanding volumes has virtually come to a complete stand-still with volumes moving sideways and 2016 is no different in that respect. At EUR2,490bn, global covered bond markets contracted by a mere EUR8bn equivalent or 0.33%.
Compared to 2015 we can welcome one new market to the covered bond family – Turkey. This brings the number of countries that had covered bonds outstanding at the end of 2016 to 31. The number of issuers re-mained broadly stable in 2015. At 310 active issuers (that operate a total of 426 covered bond programmes), the net number has gone down by 6.
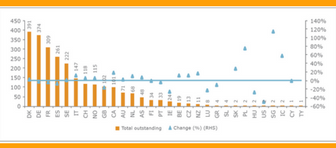
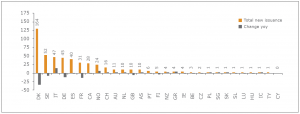
Out of these 31 countries, 16 saw their market grow in 2016. Whereas growth took place predominantly in countries outside of the Eurozone in 2015, 2016 shows a more differentiated picture. Italy and Canada lead the way with an increase of EUR16bn and EUR15bn Euro equivalent (growth of 12% and 18% respectively). On the flipside, Spain, France and Germany saw the biggest drop in market size contracting by EUR20bn (-7%), EUR14bn (-5%) and by EUR11bn (-3%).
Looking at the ranking of countries by size, we have had 5 position changes in the top ten. Denmark (EUR391bn) has replaced Germany (EUR374bn) as the largest overall market (Denmark had been the largest mortgage backed covered bond market for a very long time) while the UK (EUR102bn) dropped by two spots to number nine. Switzerland (EUR118bn) and Norway (EUR115bn) consequently moved up by one to take number seven and eight respectively.
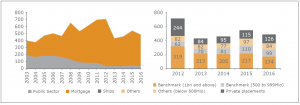
Figure 1: outstanding Covered Bonds by collateraL type (lhs) as well as currency (rhs) in EUR Bn.
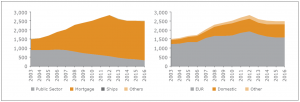
Source: Crédit Agricole CIB
Figure 2: Outstanding Covered Bonds by country as well as change vs. 2015 (EUR Bn.)
Source: Crédit Agricole CIB
As can also be seen from the charts above, despite the many discussions about covered bonds being used for additional collateral types, the market is heavily focused on the two most traditional collateral classes – mort- gages (86% after 85% in 2015) and public sector assets (13% after 15% in 2014). Ship and aircraft mortgages only represent 0.4% of the market roughly keeping the same share as in 2015.
We have had some major swings in the breakdown by placement type over the years. Having seen a big surge in volumes as banks in a number of countries used retained covered bonds as repo collateral during the crisis, the private placement category saw a big drop in 2013 (-85bn or 11%) as European lenders paid back part of their LTRO money and consequently cancelled out retained covered bonds. In 2015 this category stabilized and the same can be said for 2016. The main change compared to 2015 was a slight drop in the EUR1bn and above category (down by 2.5% or EUR30bn) while the EUR500-999m category saw an increase by around 7% or EUR26bn. This category now accounts for 15.4% of the overall market after 14.3% in 2015.
Figure 3: Outstanding Covered Bonds by issue type (lhs) as well as by coupon type (rhs) in EUR Bn.
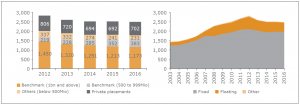
Source: Crédit Agricole CIB
Covered bond markets continued to be dominated by fixed rate bonds. Despite the low interest rate environ- ment this coupon type continues to make up 79% of the market (slightly down vs. 2015 by 0.5%). Floating rate covered bonds are predominantly either from domestic covered bond markets in the Nordics or retained bonds by issuers. The ECB is planning to change their repo haircuts to reflect the actual maturity of the bond rather than just allocating all FRN covered bonds into the 0-1Y category. We might therefore see an even more pronounced shift towards fixed rates in our statistics in the coming years. For now, however, retained covered bonds are typically being issued in FRN format to minimize ECB repo haircuts.
Looking at the breakdown by currencies, a slight contraction in EUR (down by EUR11bn) were offset by growth in domestic currencies (up by EUR19bn). This is a continuation from the 2015 statistics and when thinking about the countries with the biggest absolute drop in volumes (Spain, France, Germany) it shouldn’t come as a surprise. Other currencies (so i.e. Canadians issuing in USD or Germans issuing in GBP) fell by 9% or EUR17bn equivalent.
Evolution of covered bond issuance 2016
After EUR540bn in 2015, issuers across the globe printed EUR483bn new issuance in 2016. Having grown in 2014 (+6%) and 2015 (+18%), this is the first time in three years that new issuance has contracted compared to the previous year (-10%). While private placements increased slightly from EUR115bn to EUR126bn, it was predominantly the large benchmarks of EUR1bn and above that saw a decline in 2016 (EUR174bn in 2016 after EUR217bn in 2015).
Figure 4: Covered Bond new issuance by collateral type (lhs) as well as placement type (rhs) in EUR Bn.
Source: Crédit Agricole CIB
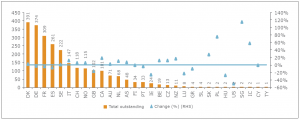
Figure 5: Covered Bonds new issuance by country as well as change vs. 2015 (EUR Bn.)
Source: Crédit Agricole CIB
Denmark is still by far the country with the largest new issue volumes (EUR129bn). The issuance volume has, however also come down by far the most. After still refinancing around 43% of the existing Danish covered bond stock in 2015, this has come down to 34% in 2016 as Danish banks try to extend into longer maturities and focus less on short term 1Y auctions. The gap to the second largest country in terms of issuance is still quite substantial though. With EUR52bn Sweden occupies that spot followed by Italy with EUR47bn.
Italy in turn has been the most dynamic in terms of increasing issuance compared to 2015 (up by 18bn). The big jump came in the private placement category, however, and not in public benchmarks. Apart from Italy, either countries saw less new issuance in 2015 or we are talking about very small and / or new markets where issuance grew by one or two billion each.
Closer look at maturity structures…
We have mentioned above that a lot of attention lately has been given to extendable maturity structures. They are nothing new by any means but in the context of the harmonisation debate, they have gained quite some prominence. To improve the information available we have added three categories to our ECBC statistics.
Based on total outstanding volumes, covered bond markets are still dominated by the most traditional of ma- turity structures, hard bullets. Close to two thirds of the market still were in this format by the end of 2016. Soft bullets make up another 35% while conditional pass through (CPT) covered bonds are a real niche product for now accounting for only 2% of the market. Looking at new issuance, however, shows a different picture and clearly points towards the direction of travel. Soft bullet covered bond new issues account for 50% of all new issuance while hard bullet covered bonds are a mere 45%. The only thing that is slightly similar between outstanding volumes and new issuance is that CPT maturity structures are still a niche product.
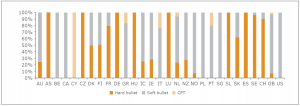
Looking at the breakdown within countries also shows that we have areas where soft bullets for instance are the market norm. The high share of hard bullets overall come from the fact that large markets such as Germany or Spain exclusively have hard bullet covered bonds while other large markets such as Sweden are predominantly hard bullet.
Figure 6: Breakdown of Covered Bonds outstanding (left) and new issuance (right) by maturity type (%)

Source: Crédit Agricole CIB
Figure 7: Breakdown of Covered Bonds outstanding by maturity type (%)
Source: Crédit Agricole CIB
How has 2017 started and what could the rest of this year hold in store…?
Covered bond benchmark issuance across currencies has seen a fairly active start in 2017 before calming down quite substantially in July. In the first six months of the year, the EUR79bn benchmark issuance in EUR as well as EUR96bn EUR equivalent in EUR, USD and GBP benchmark issuance, are around 10% less than last 2017. However, while last year saw a frantic start in Q1 followed by a dramatic slowdown in Q2-Q4, this year the first half of the year was more balanced. Q2 issuance of EUR31bn in EUR benchmarks as well as EUR37bn equivalent across EUR, GBP and USD benchmarks is the highest since 2011.
The high take-up of TLTRO II money in March this year as well as the emergence of more ready to be used MREL frameworks has impacted some regions and issuers but not dramatically dented the overall appetite. What it has done, however, it has shifted issuance for many issuers towards the long end. The average initial term of EUR benchmark new issuance has grown to 8.4 years in 2017 up from 7.5 years in 2015 and 6.8 years in 2014.
Another trend we have seen so far this year is a surprisingly strong GBP benchmark market that has been used especially by UK and Canadian issuers with the odd Australian and German bank thrown into the mix. At GBP8.0bn by early August, 2017 benchmark issuance has already surpassed 2016 and 2015 full year issuance. We have also seen large benchmarks in excess of GBP1bn with books reaching close to GBP3bn at times. At the same time USD markets have not been used as frequently in 2017. At USD10.5bn by the end of July, we are below the USD12.0bn in the first seven months of 2016 with the main difference being Canadian issuers (who have flocked to GBP markets as mentioned above).
Looking forward towards the end of this year, issuance will in our view not drop off a similar cliff as was the case last year. July was extremely quiet in EUR benchmark markets while the immediate period after the sum- mer break will likely see a lot of focus on MREL eligible securities. We do, however, still expect issuers to turn back to covered bonds in bigger volumes towards the end of the year.
Looking further ahead and into 2018, we are looking at a number of conflicting factors, some pushing for less, some for more issuance compared to 2017. Less redemptions on the one hand and ready to be used MREL frameworks across the board will be factors suppressing new issuance. At the same time growing loan books as well as considerations such as pre-funding covered bonds before QE comes to an end, slowly but surely starting to replace central bank liquidity, the need for long dated funding to match ever longer mortgages in times of low yields as well as the still challenging profitability in many countries pushing issuers to minimize funding cost should all be positives for covered bond issuance.
EBA recently published a report on banks’ funding plans 2017 to 2019. In the report the EBA criticized banks pushing unsecured as well as covered bond issuance back into 2018 and 2019 after very low funding plans for 2017. It also criticized banks’ optimistic assumptions around deposit growth.
Should, however, deposit growth in general not meet expectations or markets become more volatile after the summer for whatever reason, we might very well see some banks getting nervous that they could miss out on some still rather favourable conditions to raise money. Pre-funding and parking liquidity could very well prove to be the more lucrative option in the long run and once set in motion, new issuance could push spreads wider, leading to more new issuance as issuers rush to the market. We have been there before.
In any case the main focus after the summer will very likely lie on MREL eligible issuance. Many banks are well funded for the year and when approaching prefunding for 2018 we would imagine they go for the more complex products first before turning their attention to raising pure liquidity.
When it comes to which product to pick for liquidity purposes, senior preferred debt might actually have an edge over covered bonds for some. After all, senior preferred spread levels are so tight versus covered bonds that they could very well be the cheaper funding source. Much of the tightening has been on the back of “scarcity” of old senior preferred / opco senior debt. We might very well see that argument run a little further over the next few weeks but it might prove inaccurate in the medium term as a number of banks could use senior preferred as the cheaper product to raise liquidity rather than covered bonds (it’s not all only about MREL, after all).
The covered bond funding volumes for 2017 mentioned in the EBA report on bank funding are not dramatic in our view. We are however also looking at a situation where there will be a drop in covered bond redemptions next year as well as a CBPP 3 that will become less supportive from H2 2018 onwards.
Should we then see volatility in senior preferred and non-preferred debt as well as slower than expected deposit growth, covered bonds could attract even more attention in the next two years than is currently reflected in the funding plans and that could very well have an impact on covered bond spreads on top of the QE taper impact.
All we can say is we have ourselves a proper Mexican stand-off. Let’s see who blinks first and when. We could very well imagine it will still be in 2017.


Established in 1967, the European Mortgage Federation (EMF) is the voice of the European mortgage industry on the retail side of the business, representing the interests of mortgage lenders at European level.


