26 February 2018
The Loan To Value (LTV) ratio, defined by the rating agency DBRS as “…the ratio between the principal balance on the mortgage and the appraised value of the property serving as security for the loan itself” is a key risk indicator for mortgages. The LTV is both an indicator of default risk (when calculated at loan origination) and an indicator of expected loss, when both the loan amount and the “V” are updated overtime. It is commonly referred to in financial regulation, in rating agency methodologies, and in bank credit policy.
In this article, we take advantage of European DataWarehouse’s[1] loan level securitisation data to take a fresh look at this key indicator, and its field of application. We find that there are several ways to calculate a LTV, with different implications depending on the way it is calculated. For instance, the “V” in LTV is not normally updated following loan issuance. This results in conservative LTV estimates when prices rise post loan origination but it can also be misleading when house prices decrease.
Looking at European DataWarehouse (ED) loan by loan data, we find that LTV at origination (OLTV) differs greatly from one country to another and that, even within countries, OLTV change overtime, particularly in markets affected by significant property price volatility. We also find that, as expected, the LTV is a key performance indicator. In almost all countries, lower OLTVs are associated with better loan performance.
This article is taken from the 2017 edition of the EMF Hypostat 2017, which can be accessed here.
By Ludovic Thebault, European DataWarehouse
The Loan To Value (LTV) ratio, defined by the rating agency DBRS as “… the ratio between the principal balance on the mortgage and the appraised value of the property serving as security for the loan itself” [1]is a key risk indicator for mortgages. It is commonly referred to in financial regulation, in rating agency methodologies, and in bank credit policy. In this article, we take advantage of European DataWarehouse’s securitisation data to take a fresh look at this key indicator, and its field of application.
We find that there are several ways to calculate a LTV, with different implications depending on the way it is calculated. For instance, the “V” in LTV is not normally updated following loan issuance. This results in conservative LTV estimates when prices rise post loan origination but it can also be misleading when house prices decrease. The LTV is both an indicator of default risk (when calculated at loan origination) and an indicator of expected loss, when the “V” is updated. Looking at European DataWarehouse (ED) loan by loan data, [2] we find that LTV at origination (OLTV) differs greatly from one country to another and, even within countries, OLTV change overtime, particularly in markets affected by significant property price volatility. We also find that, as expected, the LTV is a key performance indicator. In almost all countries, the lower the LTV, the better the performance of the loan.
The LTV is typically used at loan origination, and for ongoing credit risk monitoring, to assess the amount of equity a borrower has in his property. A higher LTV indicates less equity and more risk. At loan origination, the LTV is often used alongside other indicators such as the Debt To Income (DTI) ratio, which compares the debt burden to the borrower’s income. Such ratios are often considered to be more accurate measures of loan affordability and are useful indicators of how vulnerable a borrower is to changes in economic circumstances (for example, loss of job, divorce, higher interest rates). However, these ratios tend to be only a “point in time” assessments, rarely available for post underwriting performance monitoring. Because the inputs used to calculate the DTI must be requested from the borrower (his total income and total debt), updating a DTI is not feasible without borrower cooperation. In contrast, the LTV can be easily monitored using information on the outstanding amount of the mortgage and the real estate collateral that secures it.
The LTV can be calculated in different ways, depending on how the numerator and denominator are calculated. Thus, LTV calculations can be country or even bank specific. The “V” commonly refers to the acquisition/market value of the property or to its estimated foreclosure value (net of liquidation costs). In the case of German covered bonds, the property valuation is based on the long term estimated “mortgage lending value” instead. [3] The LTV provided for Belgian loans available in ED’s database is usually calculated on an “all sum” basis, i.e. the ratio of all liabilities to assets of the borrower. In order to avoid overestimating LTVs and repayment risk, conservative property valuations are often used. For example, the rating agency Standard and Poor’s mentions that their OLTV ratio typically uses the lower of the purchase price and the original valuation of the property.[4]
In cases where a loan allows for subsequent drawings, the maximum loan limit is typically used as “L” in the calculation. Rating agencies generally factor into the LTV calculation country-specific assumptions regarding a percentage of liquidation costs and a lag until the sale of the property (the period needed to liquidate the property and during which its value may decline further). Also, in countries where regulation imposes a ceiling on the LTV, the regulator often describes how the LTV should be calculated. [5] For the sake of clarity, we will refer to the following types of LTV in this article:
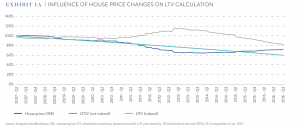
These various LTV calculations can give very different results, pointing to very different conclusions. House prices, over the long run, should generally increase with inflation. When the original valuation amount is used for the updated LTV calculation (LTOV), this generates conservative results. ED data shows that house prices are not always updated and that updated LTVs are typically based on the values at origination, only updating the L. However, when house prices decrease, this calculation can become even more misleading (Exhibit 1a). Given that a full evaluation is a costly process, revised property values, when provided, are often indexed values (LTIV). Exhibit 1a compares the evolution of the LTIV and LTOV for a Spanish loan that originated with a 100% LTV in January 2007. In Q4 2011 the LTIV is back to 100%; by Q2 2013 it stands at 115% while the LTOV indicates a value of only 76%. The LTIV is, therefore, a more appropriate measure of a loans’ Loss Given Default (LGD) in the context of sharply declining house prices.
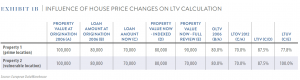
However, an LTV recalculated using an indexed property value (LTIV) may still provide an incomplete picture of the situation. Property price indices that are used to calculate LTIV are generally only provided at a broad regional level even though there may be important differences in the evolution of property prices within this region. In countries that experienced property crises, steeper price drops were often observed in newly developed estates than in prime “city centre” locations, but a geographic index would typically not account for this. Exhibit 1b shows the various LTV calculations that can be generated when comparing a property in a prime location with a property in a more vulnerable location within the same index area (and thus updated with the same index). Assuming similar loan characteristics, including a LTV at origination of 80% and a value at origination of EUR 100,000 for both properties, the current LTOV would now be 70% for both. If the relevant property index dropped 20% since origination, the indexed property value would then be EUR 80,000 for both loans within this area and the LTIV (using the indexed value) would be 87.5% for both. If, in fact, the value of the property in the prime location only dropped by 10% while the value of the property in the newly developed location fell by 30%, a fairer LTV based on an individual revaluation of property prices would show a 77.8% LTV for property 1 and a 100% LTV for property 2. If a buffer of 10% is needed to avoid losses upon liquidation (i.e. a 90% LTV), only the second, more precise, calculation indicates a risk of loss on property 2. Moody’s noted, in a study of Spanish repossessed properties using European DataWarehouse data, that overall, the price depreciation on foreclosed properties was substantially more severe than indicated by the index. They attributed this worse than average price depreciation for distressed properties to “…the forced sale process of distressed properties as opposed to sales between willing market participants”. [6] Nevertheless, European DataWarehouse intends to complete its existing data with indexed property valuations, where these are not yet available, considering that LTIVs would be useful complements to the LTOVs already available.
The LTV is used as a key input by rating agencies to determine both the default probability of a mortgage and its expected Loss LGD. The OLTV is a predictor of default for several reasons. A high OLTV implies higher leverage and, therefore, more risk. It implies that either the borrower was obliged to borrow more because he could not otherwise afford the property, or, if he chose to borrow more, that he was willing to take on more risk. Also, the amount of equity invested in the property can be used as an indicator of willingness to pay. This is particularly relevant in non-recourse jurisdictions where the loan is to be repaid solely with the proceeds of the sale of the property in case of default, with no recourse against the borrower.[7]
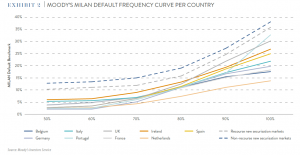
Rating agency methodologies for residential mortgage backed securities (RMBS) generally assume that default probability increases exponentially with the LTV, that the risk carried by a specific LTV level is country specific, and that the current LTV is key to assess the expected loss on the loan. For example, Moody’s MILAN methodology, [8] attributes a benchmark default frequency to a loan depending on its country of origin and OLTV. This default frequency is then adjusted with several country-specific factors. The relationship linking a LTV at origination to a default probability is not linear, as shown in Exhibit 2. For a Portuguese loan, for instance, doubling the LTV from 50% to 100% increases the default benchmark more than tenfold (from 2.5% to 32.8%), but increasing the LTV from 50% to 60% leaves the default benchmark unchanged. Other rating agencies use similar approaches.[9]
LTV values adjusted for house price variations also have some default-predicting power. This is because a borrower with a low current LTV (as measured by LTIV and LTUV), facing difficult economic circumstances (such as unemployment, divorce or long-term illness) can more easily refinance or sell his property than a borrower with a high updated LTV, at risk of becoming a “mortgage prisoner”, unable to refinance his loan. Also, in non-recourse jurisdictions, borrowers are more likely to default when they have no equity left in their property.
The updated LTV is also an essential predictor of LGD. Upon default, the property is typically repossessed by the lender and sold to repay the loan. The liquidation proceeds are first used to cover the liquidation costs and the remainder is then used to repay the loan. If the property is used as security for several loans, the senior ranking loans are paid prior to junior ranking loans, which may not be repaid in full if the proceeds are insufficient. A senior and a junior ranking loan backed by the same property can, thus, have the same probability of default (PD) but different LGDs. A given LTV ratio will, consequently, have different implications depending on country or market-specific variables such as the ranking of the loan, the liquidation costs, the timing of recoveries etc. Overestimating the value of the property for the updated LTV results in an underestimation of the LGD. [10] Also, in order to derive a possible recovery value, the indexed LTV may have to be stressed further by a Market Value Decline (MVD) assumption, that would account for further possible losses in value between the default date and the actual sale of the property. Beyond a general market decline in house prices, other factors, such as lack of maintenance, can also affect the value of a property. This is particularly relevant for borrowers who are about to default and may have neither the means nor the will to maintain their property.
The LTV plays a role in banks’ underwriting and performance management procedures. Because high LTV loans are typically expected to represent a higher risk, banks will typically extend loans with higher LTVs only to those borrowers with stronger profiles or make up for the extra risk with higher margins. For instance, it may be prudent to have lower LTVs on loans offered to self-employed borrowers (who are potentially more likely to default) than non-self-employed borrowers, all else being equal. In terms of loan performance monitoring, there is a strong incentive for lenders to prioritise higher LTV loans, particularly when real estate prices decrease, because the possible liquidation value of the property declines overtime. In terms of loan management, borrowers with high LTV loans should, therefore, expect less flexibility than others. In Structured Finance, the LTV can be used as a criterion to select loans to be included in a revolving portfolio. [11] If banks can impose LTV ceilings to limit the risks on their loans, they can also decide to lend more by increasing their LTV limit. Higher LTVs can, therefore, be indicative of a relaxation in lending criteria, a trend often seen prior to a banking crisis. While it is generally believed that higher LTVs at origination indicates a loosening in lending standards, regulation can also provide incentives to borrow with higher LTVs. In the Netherlands, for example, tax deduction on interest explains high LTVs at origination.
LTV limits are widely used in prudential regulation, often alongside limits on the DTI. Such policies were often implemented in advanced economies following the housing busts of the Great Recession [12] and appear to have been quite effective. The goal of these policies is to encourage higher equity stakes and lower leverage to increase borrower resilience and reduce bank losses in a real estate downturn. Some countries, thus, impose a simple hard LTV limit, others combine a LTV limit with other requirements while other countries have market-specific LTV limits (in terms of price or region), [13] depending on the region or economic cycle. Setting the appropriate LTV limit is a balancing act. If the limit is set too high, the loans will be riskier. If the limit is set too low, first time buyers may be priced out of the market. Sudden modification of implementation of the LTV ceiling could also have a negative impact. For example, the lowering of the LTV limit in the Netherlands is being implemented gradually by increments of 1% per year to reach 100% in 2018 (from 104% in 2014). Some categories of borrowers will be better able to cope with high LTVs if, for instance, they benefit from some sort of state support.
Also, the same LTV ceiling may not be appropriate for all stages of an economic cycle. An 80% LTV at the peak of a house price bubble may not be sufficient to avoid a loss in case of default. In the wake of a house price slump, a bank may grant 100% LTV loans to clients to purchase repossessed properties in order to clean its balance sheet (effectively swapping a defaulting borrower for a solvent one).
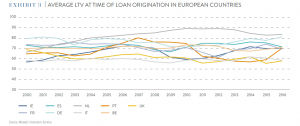
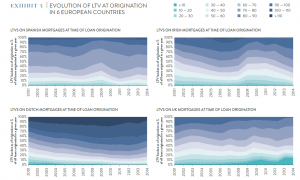
The role of the LTV for credit risk assessment led to the inclusion of several LTV-related fields in the ECB’s RMBS reporting template (see appendix). Some of these fields are optional while others are mandatory, and make it possible to store LTV relevant information overtime. Field AR135 (Original Loan to Value) [14] is a mandatory field and is, therefore, available for all RMBS loans in ED. Exhibit 3 shows that the average OLTV per country has fluctuated substantially from 2004 to 2014. Clear cyclical fluctuations are particularly visible in Spain, Ireland and Portugal. In all three countries, OLTVs increased prior to 2007 and decreased afterwards. In the case of Spain and Ireland, where house price adjustments were very sharp, we see that LTVs increased again after 2009 and 2011 respectively. This increase in LTVs after the house price correction could have several explanations. It may be due to renegotiations aimed at helping borrowers repay their loans (with a higher LTV because the house price decreased faster than the amortisation of the loans). It may also be because banks believed that house prices had reached a floor and were then willing to lend again with higher LTVs. Or, it may be the case that banks were willing to underwrite 100% LTV loans to help clients purchase the homes they had repossessed. In other countries like UK and Italy, OLTVs remained relatively stable and in the same range (lowest in Europe), while they have stayed relatively high and stable in the Netherlands.[15]
The breakdown of the various LTV buckets differs substantially by country. The average values (around 60%) for Italy and UK, are very close, and yet, the following exhibits show noticeable differences in LTV breakdown in these two markets, with fewer low and high LTVs in Italy compared to the UK. Exhibit 4 shows the evolution of the breakdown of loans originated per OLTV bucket overtime, for the countries for which ED has the most data. All patterns differ either by the proportion of loans in each OLTV bucket or by the evolution of the breakdown of OLTV buckets overtime. In Exhibit 3 and 4, we see that:
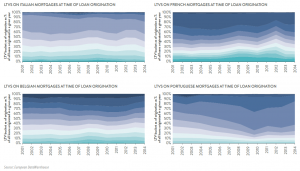
As expected, loans with higher LTVs are more common among delinquent and defaulted loans. Exhibit 5 shows the breakdown of the OLTV for the loans that were active in ED’s database as of Q1 2017 by country and loan status: performing; delinquent; or defaulted). It shows that in all countries, except France, [18] loans with higher LTVs are more common among delinquent and defaulted loans as compared with performing loans.
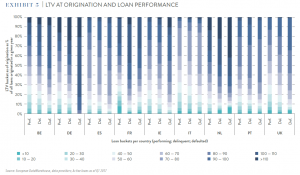
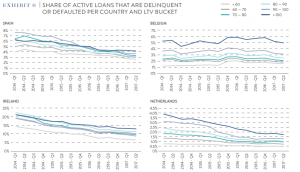
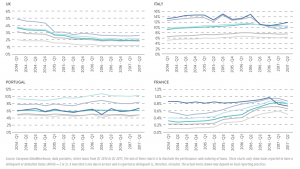
For the countries of the sample, loans with a lower LTV almost always perform substantially better than loans with a higher LTV. Exhibit 6 shows the evolution of the percentage of active delinquent and defaulted loans since Q1 2014. Overall, delinquency levels have decreased in all countries (except France) over this period, although the actual delinquency levels may not be comparable for all countries because arrears and default definitions can vary depending on the market. In some countries, for example, the Netherlands, the number of months in arrears is typically rounded up (i.e. a loan one days in arrears will be considered as one month in arrears), whereas in other markets, the number of days in arrears is rounded down, and loans may not be flagged as “in arrears” until they are already several months overdue. Also, in countries where property crises were particularly sharp or, where recovery processes can be lengthy, the number of underperforming loans is higher as the recovery processes for defaulted loans is still ongoing. The same observation also applies to countries with high levels of technical arrears.


Established in 1967, the European Mortgage Federation (EMF) is the voice of the European mortgage industry on the retail side of the business, representing the interests of mortgage lenders at European level.


